Configuring GKE-Native Monitoring and Logging
- Use Kubernetes Engine Monitoring to view cluster and workload metrics
- Use Cloud Monitoring Alerting to receive notifications about the cluster’s health
Using Kubernetes Engine Monitoring
Google Kubernetes Engine includes managed support for Monitoring.
In this task, you will create a new cluster with Kubernetes Engine Monitoring support and then perform typical monitoring tasks using the Kubernetes Engine monitoring and logging interface.
Configuring a GKE cluster with Kubernetes Engine Monitoring
student_01_ceb2542405cf@cloudshell:~ (qwiklabs-gcp-02-23e581467e33)$ history
    1  export my_zone=us-central1-c
    2  export my_cluster=standard-cluster-1
    3  source <(kubectl completion bash)
    4  gcloud container clusters create $my_cluster    --num-nodes 3 --enable-ip-alias --zone $my_zone     --logging=SYSTEM    --monitoring=SYSTEM
    5  gcloud container clusters get-credentials $my_cluster --zone $my_zone
    6  export my_zone=us-central1-c
    7  export my_cluster=standard-cluster-1
    8  export my_zone=us-central1-c
    9  gcloud container clusters get-credentials $my_cluster --zone $my_zone
   10  history
student_01_ceb2542405cf@cloudshell:~ (qwiklabs-gcp-02-23e581467e33)$
Deploy a sample workload to your GKE cluster
You will now deploy a sample workload to the default namespace of your GKE cluster. This workload consists of a deployment of three pods running a simple Hello World demo application. Later in this lab exercise, you will be able to monitor the health of this workload in Monitoring.
student_01_ceb2542405cf@cloudshell:~ (qwiklabs-gcp-02-23e581467e33)$ git clone https://github.com/GoogleCloudPlatform/training-data-analyst
Cloning into 'training-data-analyst'...
remote: Enumerating objects: 65170, done.
remote: Counting objects: 100% (76/76), done.
remote: Compressing objects: 100% (59/59), done.
remote: Total 65170 (delta 29), reused 50 (delta 16), pack-reused 65094 (from 1)
Receiving objects: 100% (65170/65170), 697.46 MiB | 28.12 MiB/s, done.
Resolving deltas: 100% (41652/41652), done.
Updating files: 100% (12870/12870), done.
student_01_ceb2542405cf@cloudshell:~ (qwiklabs-gcp-02-23e581467e33)$ ln -s ~/training-data-analyst/courses/ak8s/v1.1 ~/ak8s
student_01_ceb2542405cf@cloudshell:~ (qwiklabs-gcp-02-23e581467e33)$ cd ~/ak8s/Monitoring/
student_01_ceb2542405cf@cloudshell:~/ak8s/Monitoring (qwiklabs-gcp-02-23e581467e33)$ kubectl create -f hello-v2.yaml
deployment.apps/hello-v2 created
student_01_ceb2542405cf@cloudshell:~/ak8s/Monitoring (qwiklabs-gcp-02-23e581467e33)$ kubectl get deployments
NAME       READY   UP-TO-DATE   AVAILABLE   AGE
hello-v2   1/3     3            1           4s
student_01_ceb2542405cf@cloudshell:~/ak8s/Monitoring (qwiklabs-gcp-02-23e581467e33)$
Deploy the GCP-GKE-Monitor-Test application
You will now deploy the GCP-GKE-Monitor-Test application to the default namespace of your GKE cluster. This workload has a deployment consisting of a single pod that is then exposed to the internet via a LoadBalancer service.
In the Cloud Shell, execute the following command to build the Docker image for the load testing application and push the image to the Google gcr.io registry for your lab project:
Alternatively, you can also use Docker directly to build and push an image to gcr.io:
docker build -t gcr.io/${PROJECT_ID}/gcp-gke-monitor-test .
student_01_ceb2542405cf@cloudshell:~/ak8s/Monitoring (qwiklabs-gcp-02-23e581467e33)$ kubectl create -f hello-v2.yaml
deployment.apps/hello-v2 created
student_01_ceb2542405cf@cloudshell:~/ak8s/Monitoring (qwiklabs-gcp-02-23e581467e33)$ kubectl get deployments
NAME       READY   UP-TO-DATE   AVAILABLE   AGE
hello-v2   1/3     3            1           4s
student_01_ceb2542405cf@cloudshell:~/ak8s/Monitoring (qwiklabs-gcp-02-23e581467e33)$ export PROJECT_ID="$(gcloud config get-value project -q)"
Your active configuration is: [cloudshell-25785]
student_01_ceb2542405cf@cloudshell:~/ak8s/Monitoring (qwiklabs-gcp-02-23e581467e33)$ cd gcp-gke-monitor-test
student_01_ceb2542405cf@cloudshell:~/ak8s/Monitoring/gcp-gke-monitor-test (qwiklabs-gcp-02-23e581467e33)$ gcloud builds submit --tag=gcr.io/$PROJECT_ID/gcp-gke-monitor-test .
Creating temporary archive of 15 file(s) totalling 252.7 KiB before compression.
Some files were not included in the source upload.

Check the gcloud log [/tmp/tmp.hXX6dQyNvh/logs/2024.08.15/16.19.56.433865.log] to see which files and the contents of the
default gcloudignore file used (see `$ gcloud topic gcloudignore` to learn
more).

Uploading tarball of [.] to [gs://qwiklabs-gcp-02-23e581467e33_cloudbuild/source/1723738796.773995-3096216f0f564c478e76ac630cf5c69e.tgz]
Created [https://cloudbuild.googleapis.com/v1/projects/qwiklabs-gcp-02-23e581467e33/locations/global/builds/ec9fbf3c-8646-4546-a53c-2a4886259512].
Logs are available at [ https://console.cloud.google.com/cloud-build/builds/ec9fbf3c-8646-4546-a53c-2a4886259512?project=669576400649 ].
Waiting for build to complete. Polling interval: 1 second(s).
------------------------------------------------------------------------------- REMOTE BUILD OUTPUT --------------------------------------------------------------------------------
starting build "ec9fbf3c-8646-4546-a53c-2a4886259512"

FETCHSOURCE
Fetching storage object: gs://qwiklabs-gcp-02-23e581467e33_cloudbuild/source/1723738796.773995-3096216f0f564c478e76ac630cf5c69e.tgz#1723738798337701
Copying gs://qwiklabs-gcp-02-23e581467e33_cloudbuild/source/1723738796.773995-3096216f0f564c478e76ac630cf5c69e.tgz#1723738798337701...
/ [1 files][166.4 KiB/166.4 KiB]
Operation completed over 1 objects/166.4 KiB.
BUILD
Already have image (with digest): gcr.io/cloud-builders/docker
Sending build context to Docker daemon  73.73kB
Step 1/7 : FROM node:10-alpine
10-alpine: Pulling from library/node
ddad3d7c1e96: Pulling fs layer
de915e575d22: Pulling fs layer
7150aa69525b: Pulling fs layer
d7aa47be044e: Pulling fs layer
d7aa47be044e: Waiting
ddad3d7c1e96: Verifying Checksum
ddad3d7c1e96: Download complete
7150aa69525b: Verifying Checksum
7150aa69525b: Download complete
d7aa47be044e: Verifying Checksum
d7aa47be044e: Download complete
ddad3d7c1e96: Pull complete
de915e575d22: Verifying Checksum
de915e575d22: Download complete
de915e575d22: Pull complete
7150aa69525b: Pull complete
d7aa47be044e: Pull complete
Digest: sha256:dc98dac24efd4254f75976c40bce46944697a110d06ce7fa47e7268470cf2e28
Status: Downloaded newer image for node:10-alpine
 aa67ba258e18
Step 2/7 : WORKDIR /usr/src/app
 Running in 47fa60dcf518
Removing intermediate container 47fa60dcf518
 19b960377e1a
Step 3/7 : COPY package*.json ./
 b16df8d36d7c
Step 4/7 : RUN npm ci --only=production
 Running in 9c32900cb909

> protobufjs@6.8.8 postinstall /usr/src/app/node_modules/protobufjs
> node scripts/postinstall

added 122 packages in 3.529s
Removing intermediate container 9c32900cb909
 60c8c9070c43
Step 5/7 : COPY . .
 125279d42868
Step 6/7 : EXPOSE 8080
 Running in 35a5cc0f19c3
Removing intermediate container 35a5cc0f19c3
 82b3799b1155
Step 7/7 : CMD [ "node", "server.js" ]
 Running in e1e821404a77
Removing intermediate container e1e821404a77
 0ff1ce030ffd
Successfully built 0ff1ce030ffd
Successfully tagged gcr.io/qwiklabs-gcp-02-23e581467e33/gcp-gke-monitor-test:latest
PUSH
Pushing gcr.io/qwiklabs-gcp-02-23e581467e33/gcp-gke-monitor-test
The push refers to repository [gcr.io/qwiklabs-gcp-02-23e581467e33/gcp-gke-monitor-test]
479667c3489b: Preparing
89fc8f000f30: Preparing
e14867604c4e: Preparing
f217e951ce15: Preparing
edff9ff691d5: Preparing
cbe4b9146f86: Preparing
a6524c5b12a6: Preparing
9a5d14f9f550: Preparing
cbe4b9146f86: Waiting
a6524c5b12a6: Waiting
9a5d14f9f550: Waiting
edff9ff691d5: Layer already exists
cbe4b9146f86: Layer already exists
f217e951ce15: Pushed
a6524c5b12a6: Layer already exists
e14867604c4e: Pushed
9a5d14f9f550: Layer already exists
89fc8f000f30: Pushed
479667c3489b: Pushed
latest: digest: sha256:0d0c3f15286008d73c7221068f10f65b515990c4961e0d1884b8d2f65bbf5cfa size: 1995
DONE
------------------------------------------------------------------------------------------------------------------------------------------------------------------------------------
ID: ec9fbf3c-8646-4546-a53c-2a4886259512
CREATE_TIME: 2024-08-15T16:19:58+00:00
DURATION: 44S
SOURCE: gs://qwiklabs-gcp-02-23e581467e33_cloudbuild/source/1723738796.773995-3096216f0f564c478e76ac630cf5c69e.tgz
IMAGES: gcr.io/qwiklabs-gcp-02-23e581467e33/gcp-gke-monitor-test (+1 more)
STATUS: SUCCESS
student_01_ceb2542405cf@cloudshell:~/ak8s/Monitoring/gcp-gke-monitor-test (qwiklabs-gcp-02-23e581467e33)$
student_01_ceb2542405cf@cloudshell:~/ak8s/Monitoring (qwiklabs-gcp-02-23e581467e33)$ cat gcp-gke-monitor-test.yaml
apiVersion: apps/v1
kind: Deployment
metadata:
  labels:
    name: gcp-gke-monitor-test
  name: gcp-gke-monitor-test
  namespace: default
spec:
  replicas: 1
  selector:
    matchLabels:
      name: gcp-gke-monitor-test
  template:
    metadata:
      labels:
        name: gcp-gke-monitor-test
    spec:
      containers:
      - image: gcr.io/qwiklabs-gcp-02-23e581467e33/gcp-gke-monitor-test:latest
        name: gcp-gke-monitor-test
        ports:
        - containerPort: 8080
          protocol: TCP
        env:
        - name: POD_ID
          valueFrom:
            fieldRef:
              fieldPath: metadata.uid
        - name: POD_NAME
          valueFrom:
            fieldRef:
              fieldPath: metadata.name
        - name: NAMESPACE_NAME
          valueFrom:
            fieldRef:
              fieldPath: metadata.namespace

---
apiVersion: v1
kind: Service
metadata:
  labels:
    name: gcp-gke-monitor-test
  name: gcp-gke-monitor-test-service
  namespace: default
spec:
  ports:
  - port: 80
    protocol: TCP
    targetPort: 8080
  selector:
    name: gcp-gke-monitor-test
  type: LoadBalancer
student_01_ceb2542405cf@cloudshell:~/ak8s/Monitoring (qwiklabs-gcp-02-23e581467e33)$ kubectl create -f gcp-gke-monitor-test.yaml
deployment.apps/gcp-gke-monitor-test created
service/gcp-gke-monitor-test-service created
student_01_ceb2542405cf@cloudshell:~/ak8s/Monitoring (qwiklabs-gcp-02-23e581467e33)$
student_01_ceb2542405cf@cloudshell:~/ak8s/Monitoring (qwiklabs-gcp-02-23e581467e33)$ kubectl get deployments
NAME                   READY   UP-TO-DATE   AVAILABLE   AGE
gcp-gke-monitor-test   1/1     1            1           24s
hello-v2               3/3     3            3           4m4s
student_01_ceb2542405cf@cloudshell:~/ak8s/Monitoring (qwiklabs-gcp-02-23e581467e33)$ kubectl get svc
NAME                           TYPE           CLUSTER-IP       EXTERNAL-IP   PORT(S)        AGE
gcp-gke-monitor-test-service   LoadBalancer   34.118.238.136   <pending>     80:31390/TCP   27s
kubernetes                     ClusterIP      34.118.224.1     <none>        443/TCP        30m
student_01_ceb2542405cf@cloudshell:~/ak8s/Monitoring (qwiklabs-gcp-02-23e581467e33)$ kubectl get svc
NAME                           TYPE           CLUSTER-IP       EXTERNAL-IP    PORT(S)        AGE
gcp-gke-monitor-test-service   LoadBalancer   34.118.238.136   35.188.80.83   80:31390/TCP   52s
kubernetes                     ClusterIP      34.118.224.1     <none>         443/TCP        30m
student_01_ceb2542405cf@cloudshell:~/ak8s/Monitoring (qwiklabs-gcp-02-23e581467e33)$
Using the GCP-GKE-Monitor-Test application
In this task, you will use the GCP-GKE-Monitor-Test application to explore different aspects of Kubernetes Engine Monitoring. The tool is composed of four sections:
- Generate CPU Load
- Custom Metrics
- Log Test
- Crash the Pod
n the first section, Generate CPU Load, you have buttons to start and stop a CPU Load Generator. The tool starts a loop of math operations which will consume an entire CPU core. To prevent losing control of the pod due to CPU saturation, the loop yields the processor periodically for 100 nanoseconds. This allows you to quickly stop the CPU Load Generator without killing the pod.
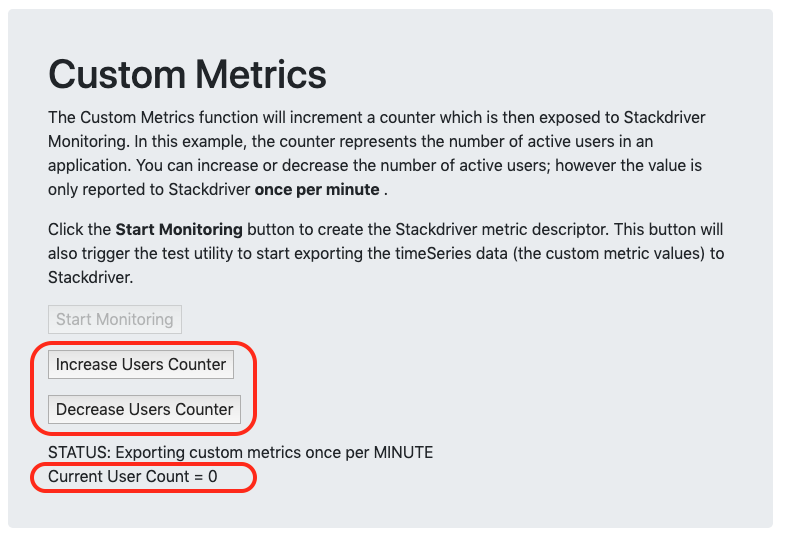
The second section, Custom Metrics, allows you to explore custom metric monitoring within Cloud Monitoring. When you click Start Monitoring, the tool first creates the necessary Custom Metric Descriptor, and then starts a loop which sends the custom metric values to Monitoring every 60 seconds. The custom metrics coded into this tool are designed to simulate an application that can keep track of the number of active users connected, and then report that number to an external service.
To take advantage of these custom metrics, some additional instrumentation may be required within your application’s code. In this lab exercise you can simulate users connecting and disconnecting by clicking the Increase and Decrease Users buttons.
Also keep in mind that although the web tool will allow you to change the number of users in real time (just as users may connect and disconnect in real life), the Cloud Monitoring APIs only allow the tool to send its current value once per minute. This means your Cloud Monitoring charts will not reflect changes which occur between the per-minute updates.
The third section, Log Test, allows you to send different text strings to the container’s standard output (the console), which is then periodically collected by Cloud Monitoring and stored as log messages associated with the pod and container. You can optionally enable Debug-level logging to see more entries in the logs. This will allow you to see messages in the logs when you increase the number of users in the Custom Metrics section, or when you enable or disable the CPU Load Generator. Note that these logs are sent in plain-text format to simulate legacy applications which do not support JSON formatted messages. When you view the logs in Logging you will notice that your pod’s JSON-based Kubernetes event logs have much more robust filtering and querying options than what is available for the unstructured logs.
The fourth and final section, Crash the Pod, allows you to crash the pod with the click of a button. The tool executes a section of code with an unhandled error, which crashes the pod and triggers the deployment to restart a new pod in its place. You can use this tool to see how quickly Kubernetes Engine can recover from errors. It is also an opportunity to see the loss of session state in action because each pod maintains its own session instead of storing it in a central location. When the pod restarts, all your toggle buttons and settings return to their default values.
Start the CPU Load Generator
You will now open a web browser, connect to the GCP-GKE-Monitor-Test tool, and start the CPU load generator.
In the Generate CPU Load section, click the Start CPU Load button. Note that the STATUS text will change when the load generator starts running.
Start collecting custom metrics
You will now start a process within the GCP-GKE-Monitor-Test tool which creates a Custom Metric Descriptor within Cloud Monitoring. Later, when the tool begins sending the custom metric data, Monitoring will associate the data with this metric descriptor. Note that Monitoring can often automatically create the custom metric descriptors for you when you send the custom metric data, but creating the descriptor manually gives you more control over the text that appears in the Monitoring interface, making it easier for you to find your data in the Metric Explorer.
- In the GCP-GKE-Monitor-Test tool, in the Custom Metrics section, click the Start Monitoring button.
ou can now click the Increase and Decrease Users buttons to change the Current User Count displayed below the STATUS text.
- Click Increase Users Counter and repeat until the Current User Count is set to 10 users.
It may take 2-3 minutes for the first data point to appear in Monitoring. You will check this custom metric in Cloud Monitoring in a later step.
Generate test log messages
You will now use the GCP-GKE-Monitor-Test tool to create sample text-based logs which you will later view in Cloud Monitoring.
In the GCP-GKE-Monitor-Test tool, in the Log Test section, click the Enable Debug Logging button to increase the number of logs the tool generates.
Click the other four log entry buttons to generate some additional sample log messages. It’s important to select a variety of severity levels so that you can see how the different message types are displayed in Monitoring.
Using Kubernetes Engine Monitoring
In this task, you will use Kubernetes Engine Monitoring to view the current health of your GKE cluster and the two workloads running on it.
Create a Monitoring workspace
You will now setup a Monitoring workspace that’s tied to your Google Cloud Project. The following steps create a new account that has a free trial of Monitoring.
- In the Cloud Console, click on Navigation menu > Monitoring.
Review the Kubernetes Engine monitoring interface
You will now open and browse the three different sections of the Kubernetes Engine Monitoring interface. The three sections are: Infrastructure, Workloads, and Services.
Note: The GKE option might not appear immediately in the Monitoring menus. It might take 5 to 10 minutes to enable the cluster for the new features. Refresh your page periodically until the option appears.
Examine each section in the interface:
- The Clusters, Nodes, and Pods sections allow you to check the health of particular elements in the cluster. You can also use this to inspect the pods which are running on a particular node in the cluster.
- To see the details of your cluster, click on the cluster element.
- The Workloads section is very helpful, especially when looking for workloads which do not have services exposed.
- The Kubernetes services section organizes the services configured in your environment by cluster, then by namespace (the administrative barrier or partition within the cluster), and then shows the various services available to users within that namespace. You can see more details on each service by clicking on their name.
- The Namespaces section shows the list of namespaces within the cluster.
The monitoring interface can provide even more detail about the deployments and pods.
You now have a dashboard showing a single chart with a standard Monitoring metric. Next, you will create a chart for our custom Monitoring metric and then add it to this dashboard.
- Click Metrics explorer.
- Click on Select a metric.
- Select Kubernetes Pod > Custom metrics > Web App - Active Users.
- Click Apply.
- Click on Save Chart.
- Give the new chart a name, such as Active Users.
- Select Container Dashboard from the dashboards dropdown.
- Click Save Chart.
- Navigate back to your Container dashboard and click the Gear icons to display the settings menu.
- Then click Legends > Table to display the text under each chart.
- Click the three vertical bars next to the word Value at the right of each chart.
This displays a popup which contains the various labels which were included in the timeSeries data sent by our application server. You can use this information to filter or even aggregate the data in the chart.
Creating alerts with Kubernetes Engine Monitoring
In this task, you will configure an alert within Kubernetes Engine Monitoring and then use the dashboard to identify and respond to the incident.
Create an Alert Policy
You will now create an alert policy to detect high CPU utilization among the containers.
- In the Cloud Console, from the Navigation menu, select Monitoring > Detect >Alerting.
- Click + Create Policy.
- Click on Select a metric dropdown.
- Uncheck the Active option.
- Type Kubernetes Container in filter by resource and metric name.
- Click on Kubernetes Container > Container.
- Select CPU request utilization.
- Click Apply. Note: If you cannot locate the Kubernetes Container resource type, you might have to refresh the page.
- Set Rolling windows to 1 min.
- Click Next.
- Set Threshold position to Above Threshold.
- Set 0.99 as your Threshold value.
- Click Next.
Respond to an Incident
Now, you will return to the monitoring dashboard where an incident is being reported on one of the containers.
- In the Monitoring page, select Overview > GKE. On the Kubernetes Engine Monitoring dashboard, you should see an incident reported on the container.
- In the Containers tab, click on the container name which shows the alert. It will take a minute or two to register the alert and you may need to refresh the page to see the alert.
- Go to Alerting page.
- Click the alert name CPU request utilization to view additional details.
- Open the incident and click on the Incident summary entry.
- Click on Acknowledge Incident. The incident status now shows Acknowledged, but that doesn’t solve the problem. You need to fix the root cause of the problem; the CPU Load Generator container.
- Open the web interface for the GCP-GKE-Monitor-Test tool.
- In the Generate CPU Load section, click the Stop CPU Load button to resolve the issue by stopping the CPU Load Generator.
- You may now close the GCP-GKE-Monitor-Test web browser window.
 Alert firing No severity
Kubernetes Container - CPU request utilization is above threshold of 0.99 with a value of 8.0790349730652622
| Start time Aug 15, 2024 at 4:46PM UTC (less than 1 sec ago) | Policy CPU request utilization | |
|---|---|---|
| Project qwiklabs-gcp-02-23e581467e33 | Condition Kubernetes Container - CPU request utilization |
metric : kubernetes.io/container/cpu/request_utilization
cluster_name : standard-cluster-1
container_name : metrics-server-nanny
location : us-central1-c
namespace_name : kube-system
pod_name : metrics-server-v0.7.1-868cd77b76-24szw
project_id : qwiklabs-gcp-02-23e581467e33