Troubleshooting Workloads on GKE for Site Reliability Engineers
Learn how to take advantage of the integrated capabilities of Google Cloud’s operations suite that includes logging, monitoring, and rich, out-of-the-box dashboards.
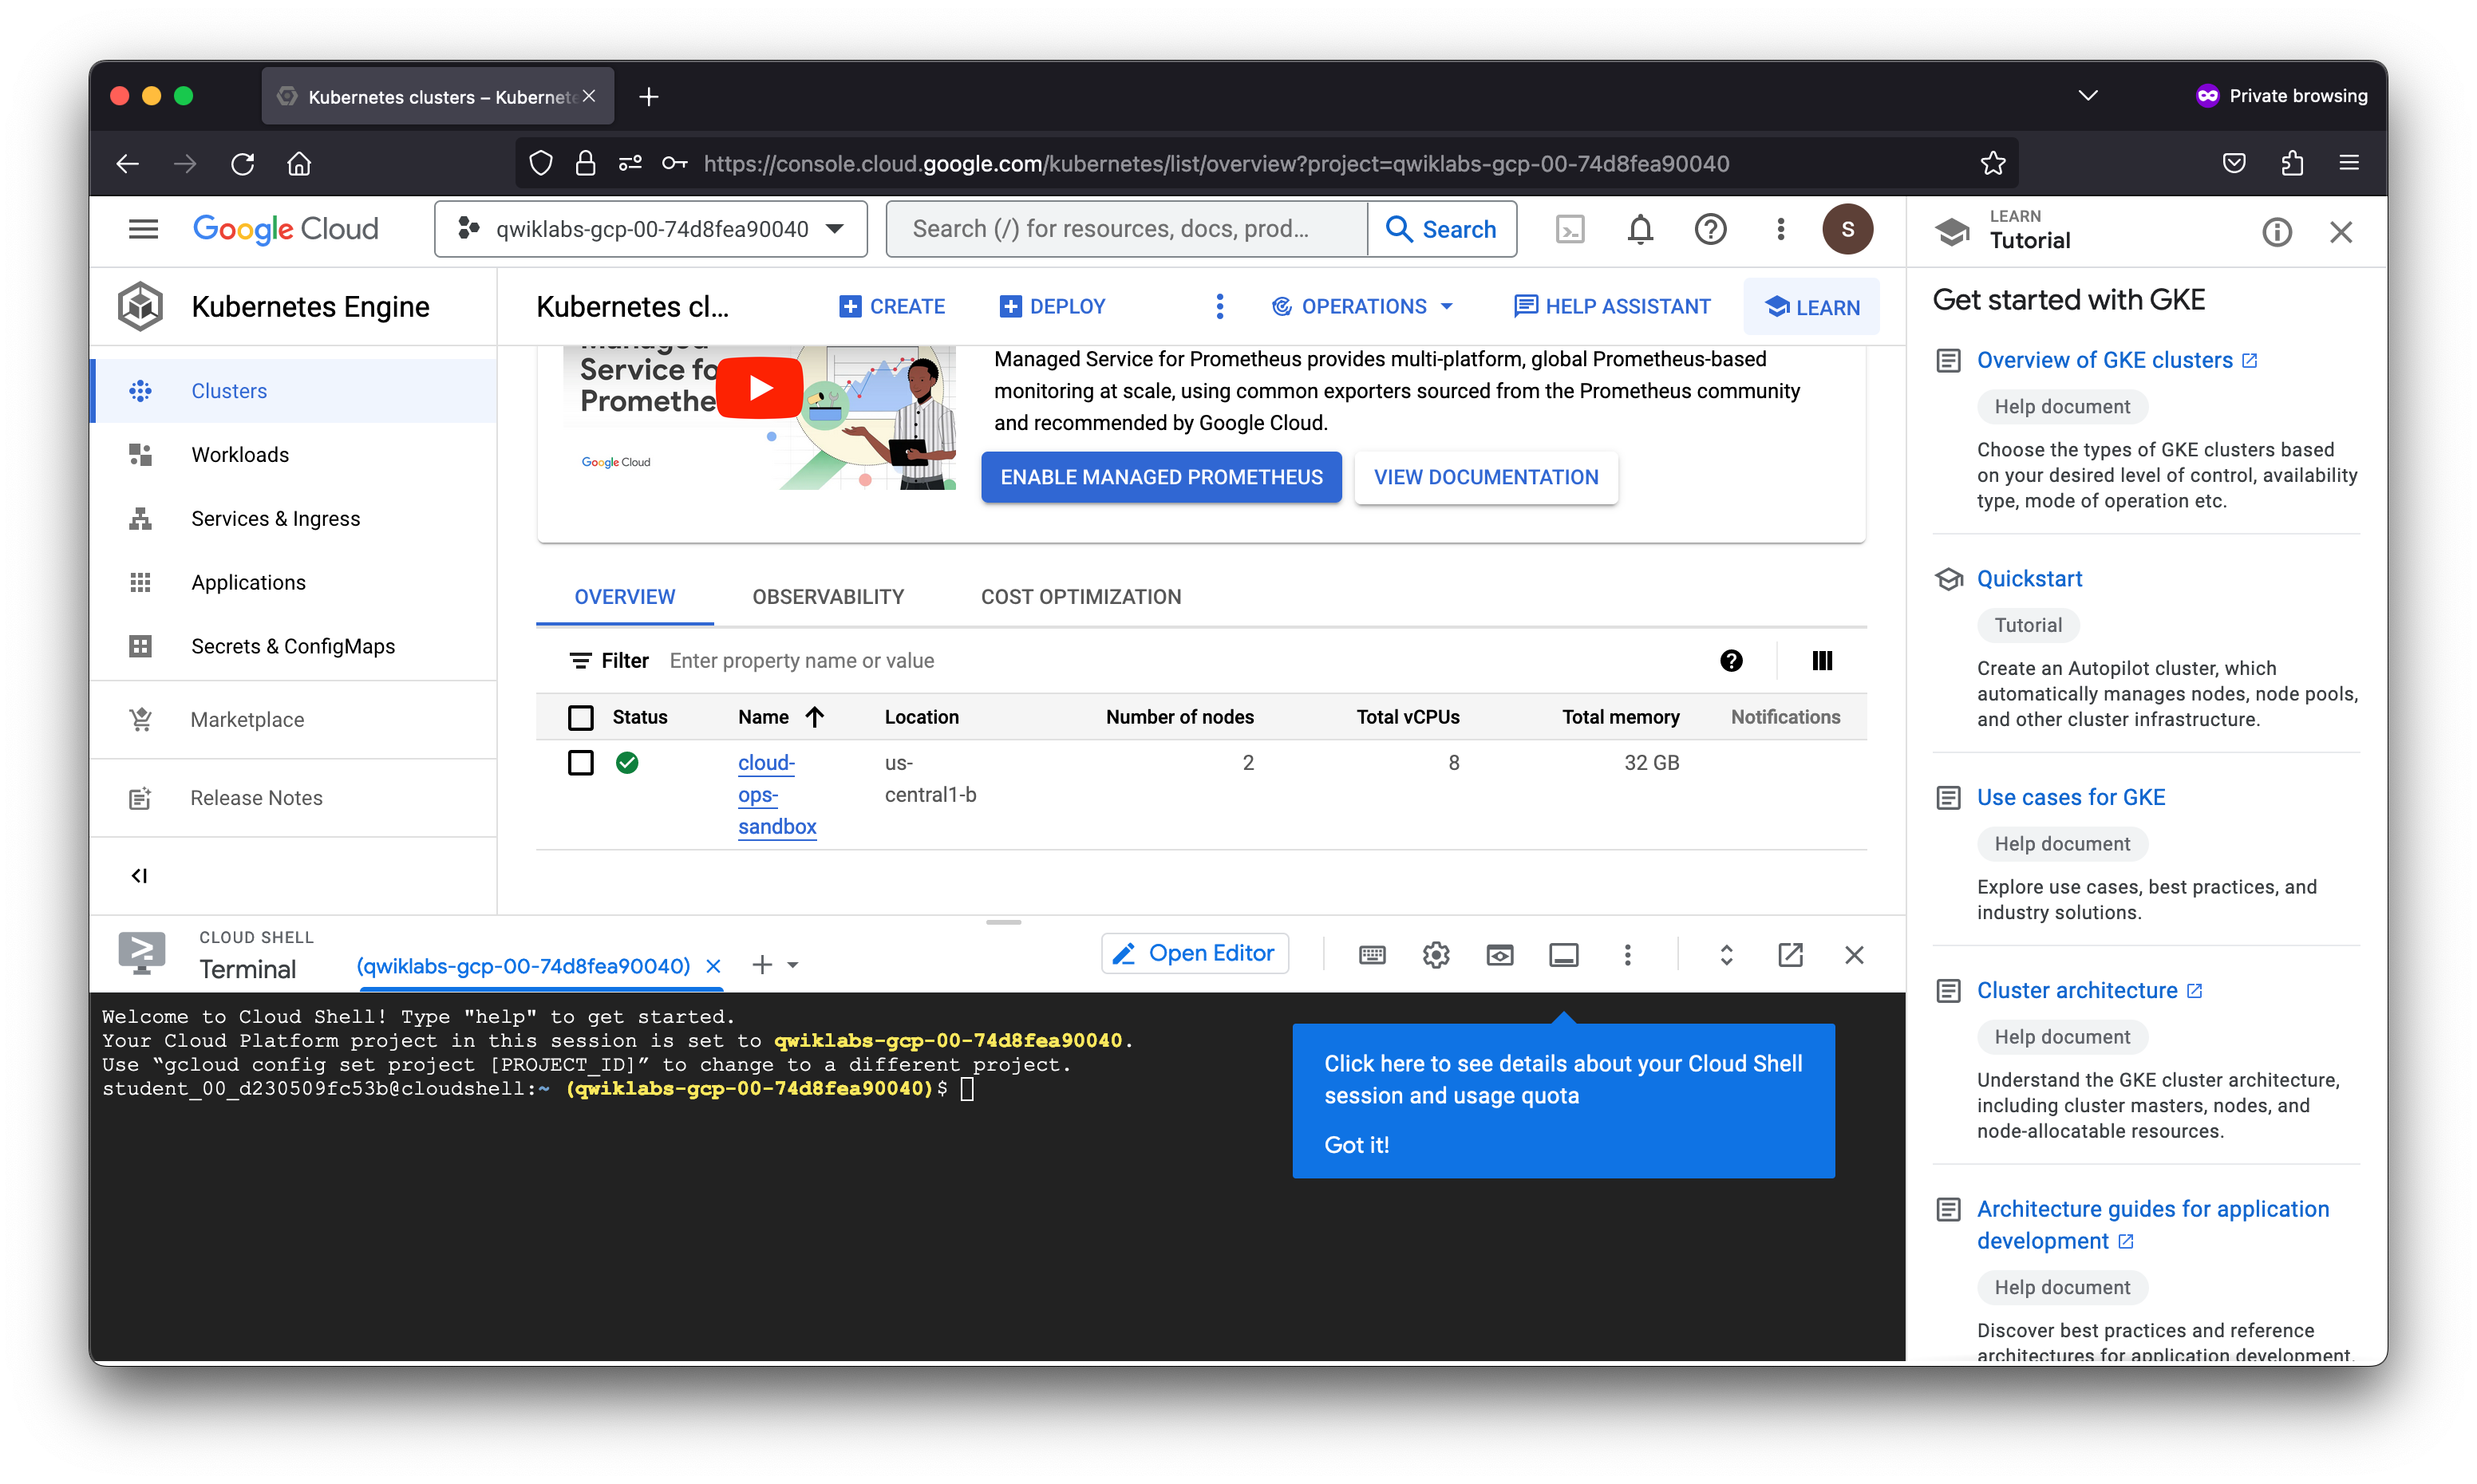
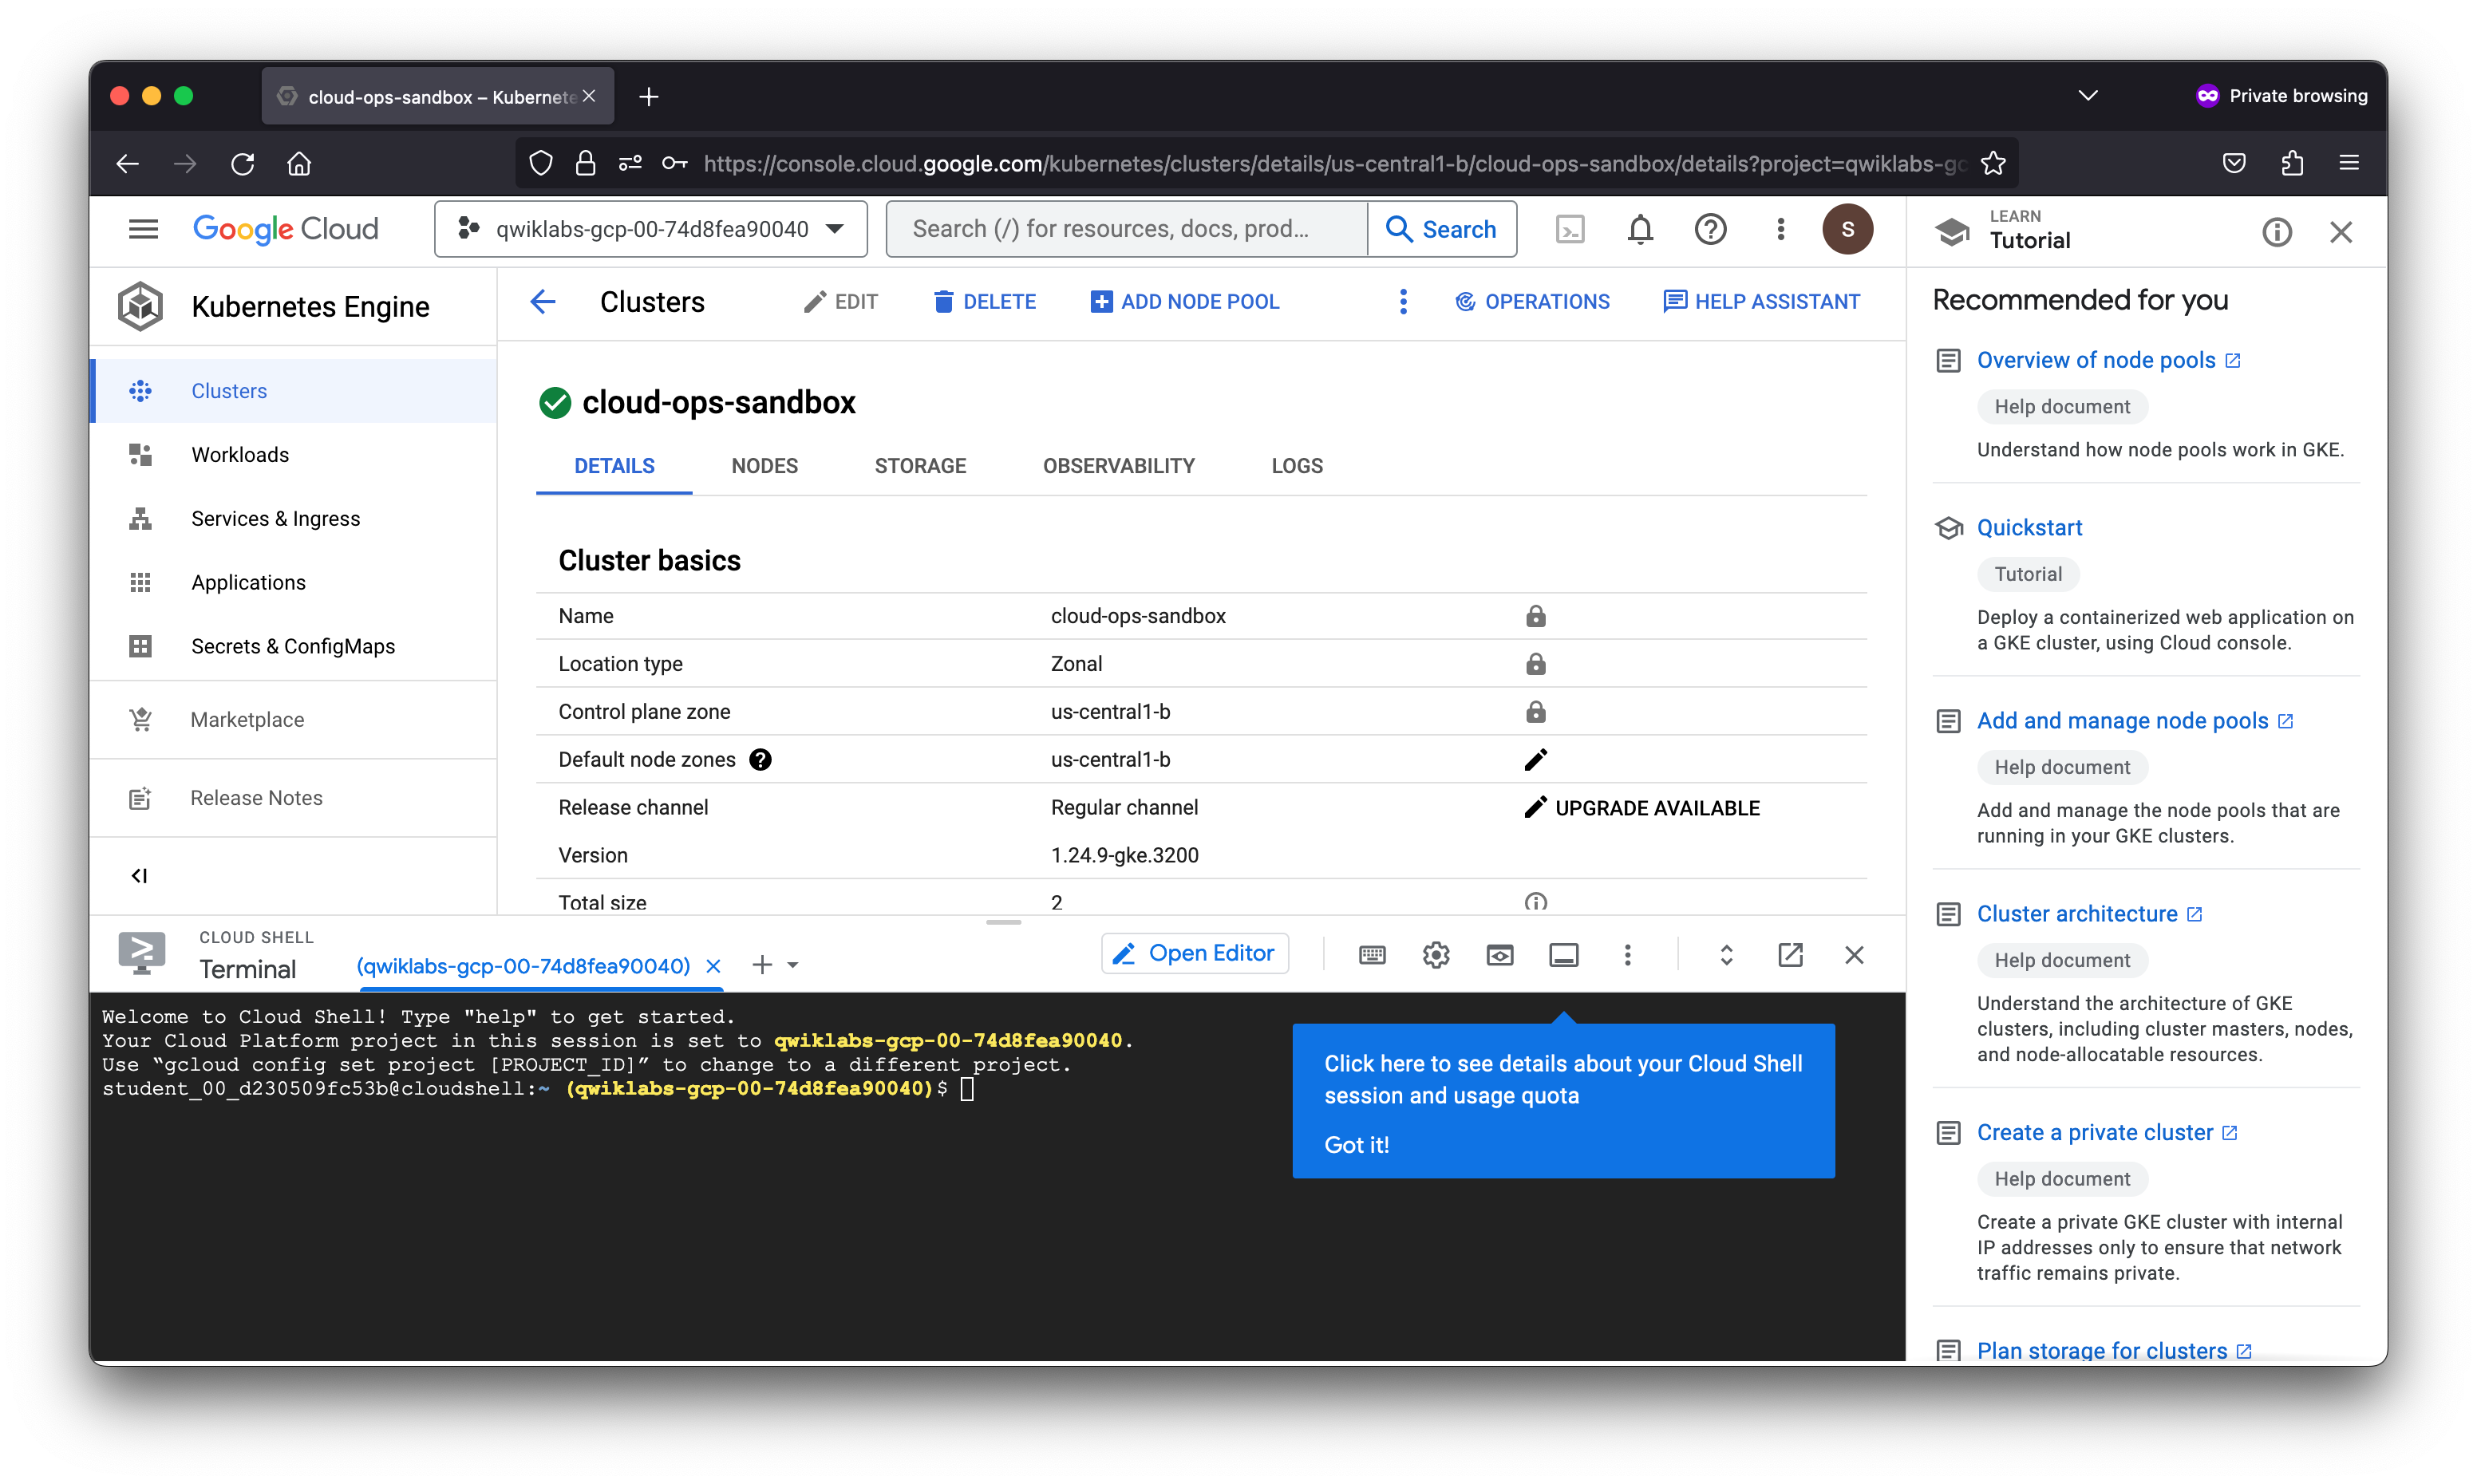
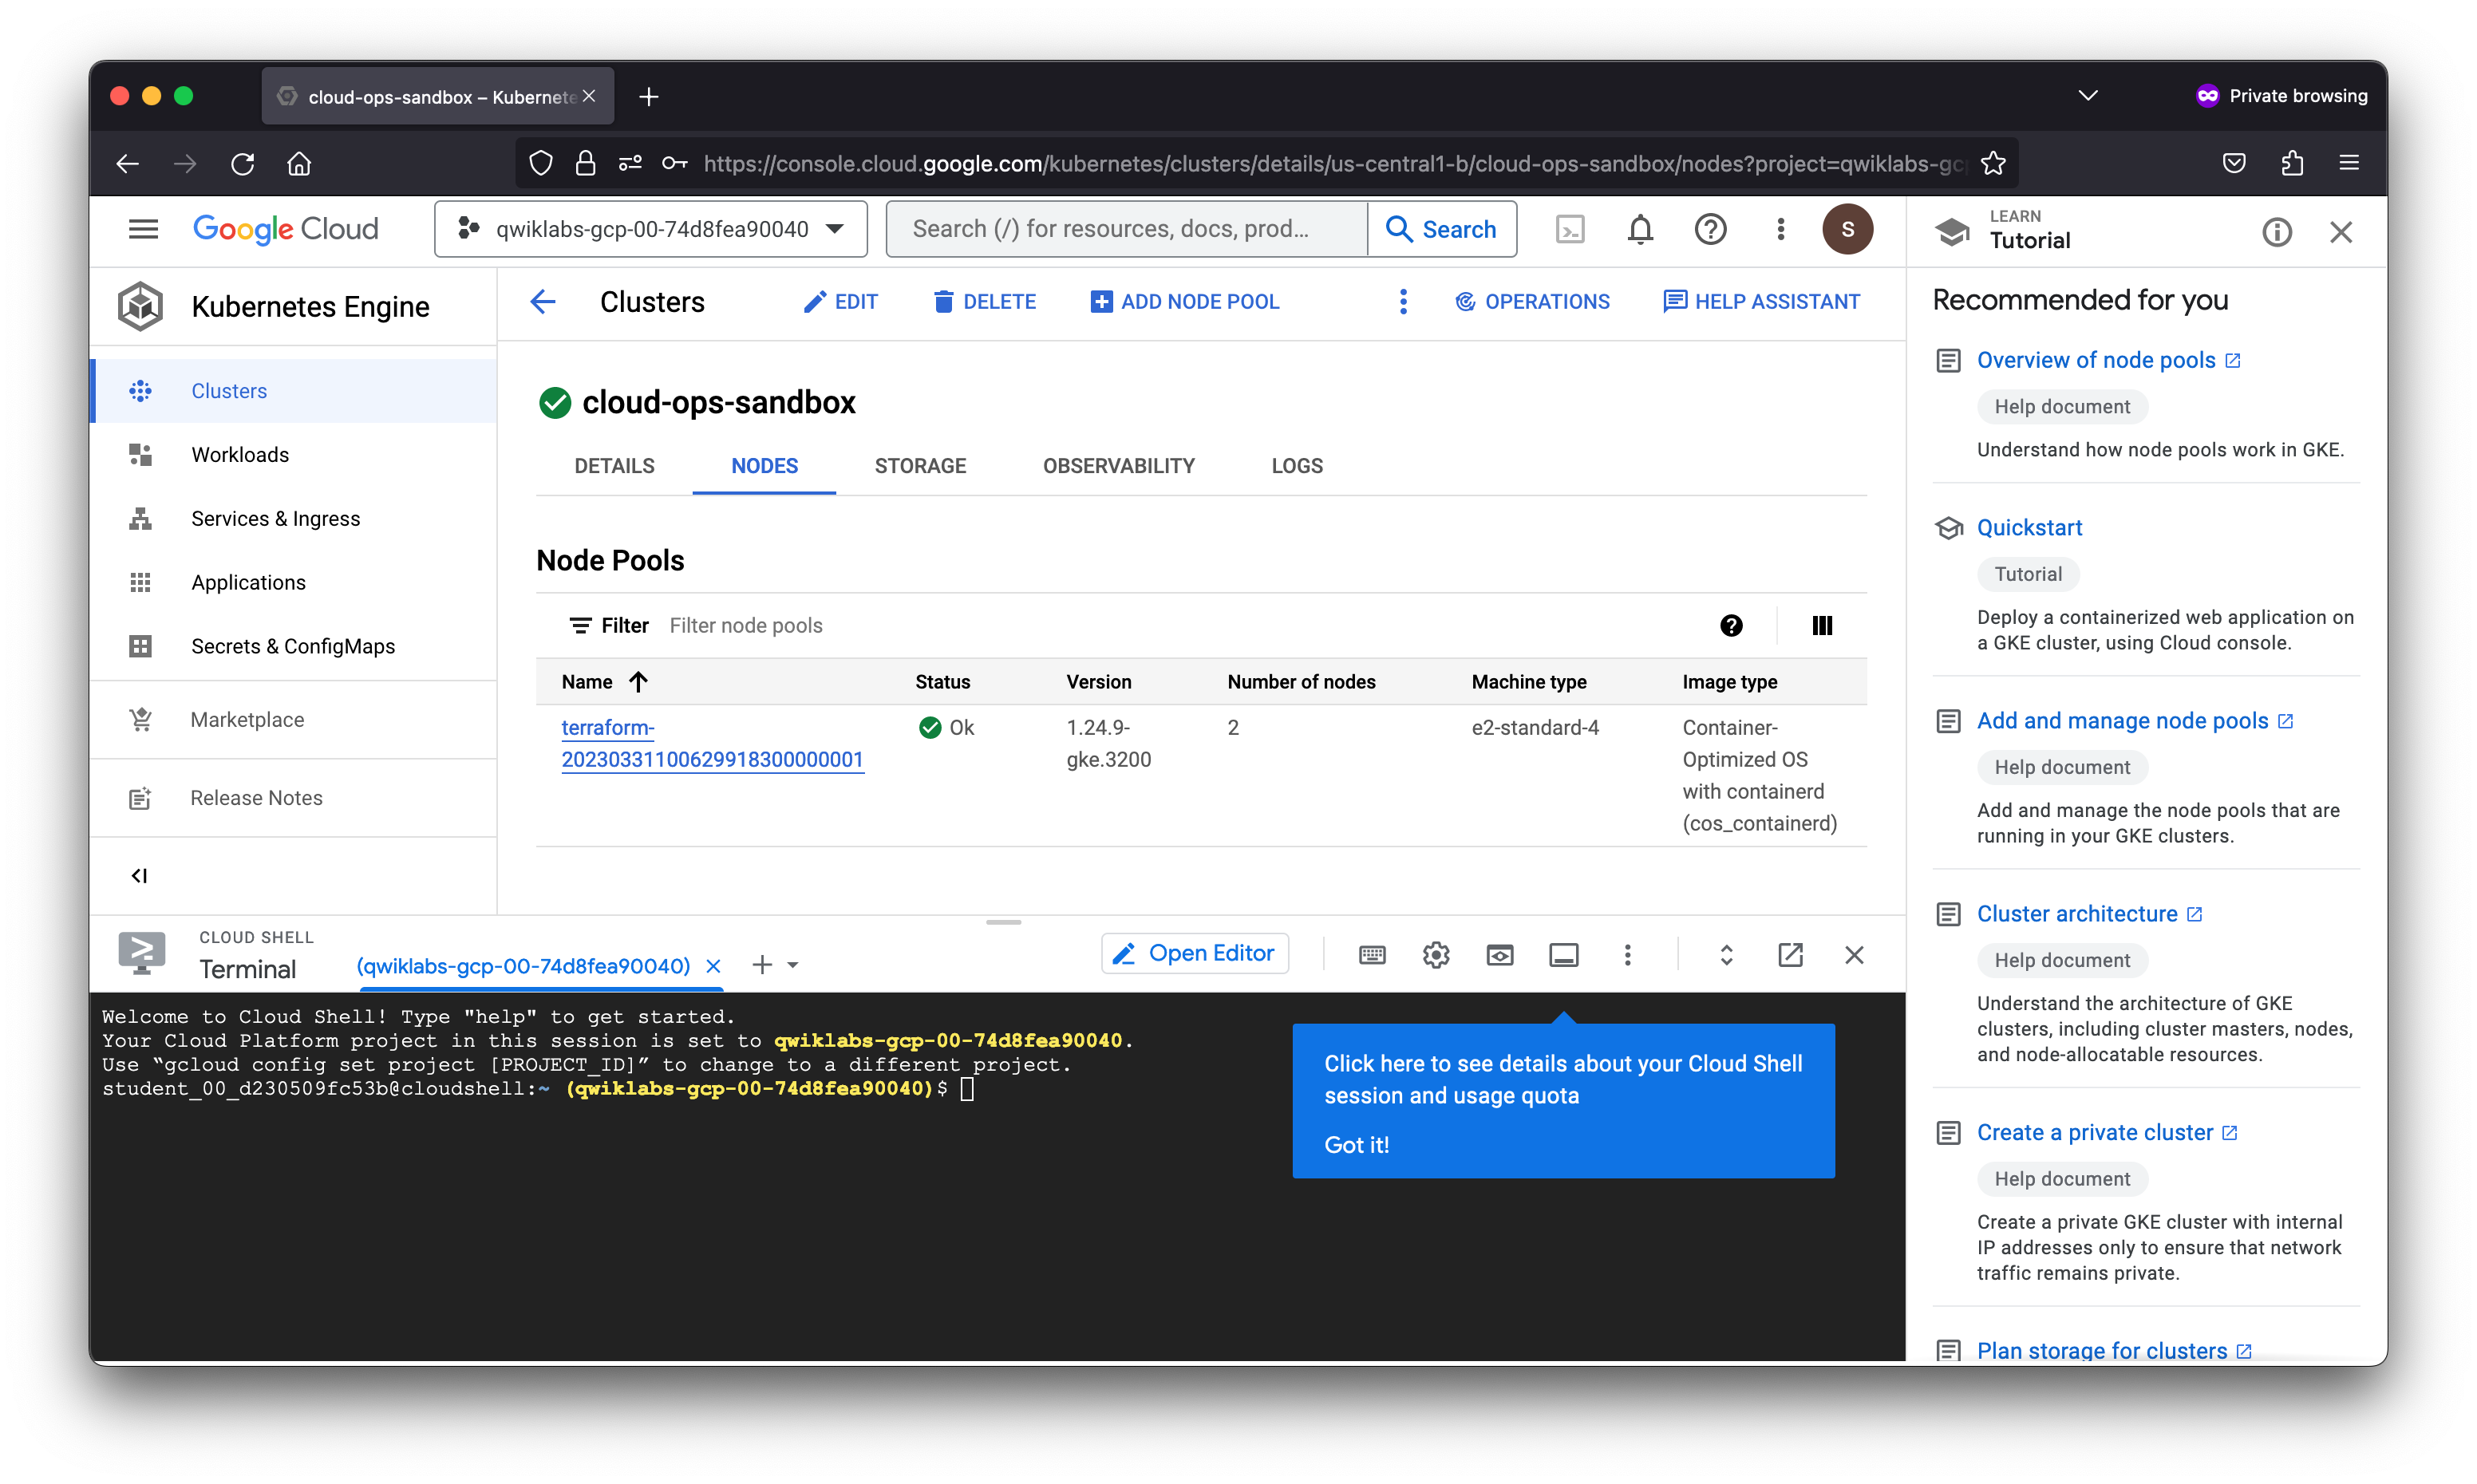
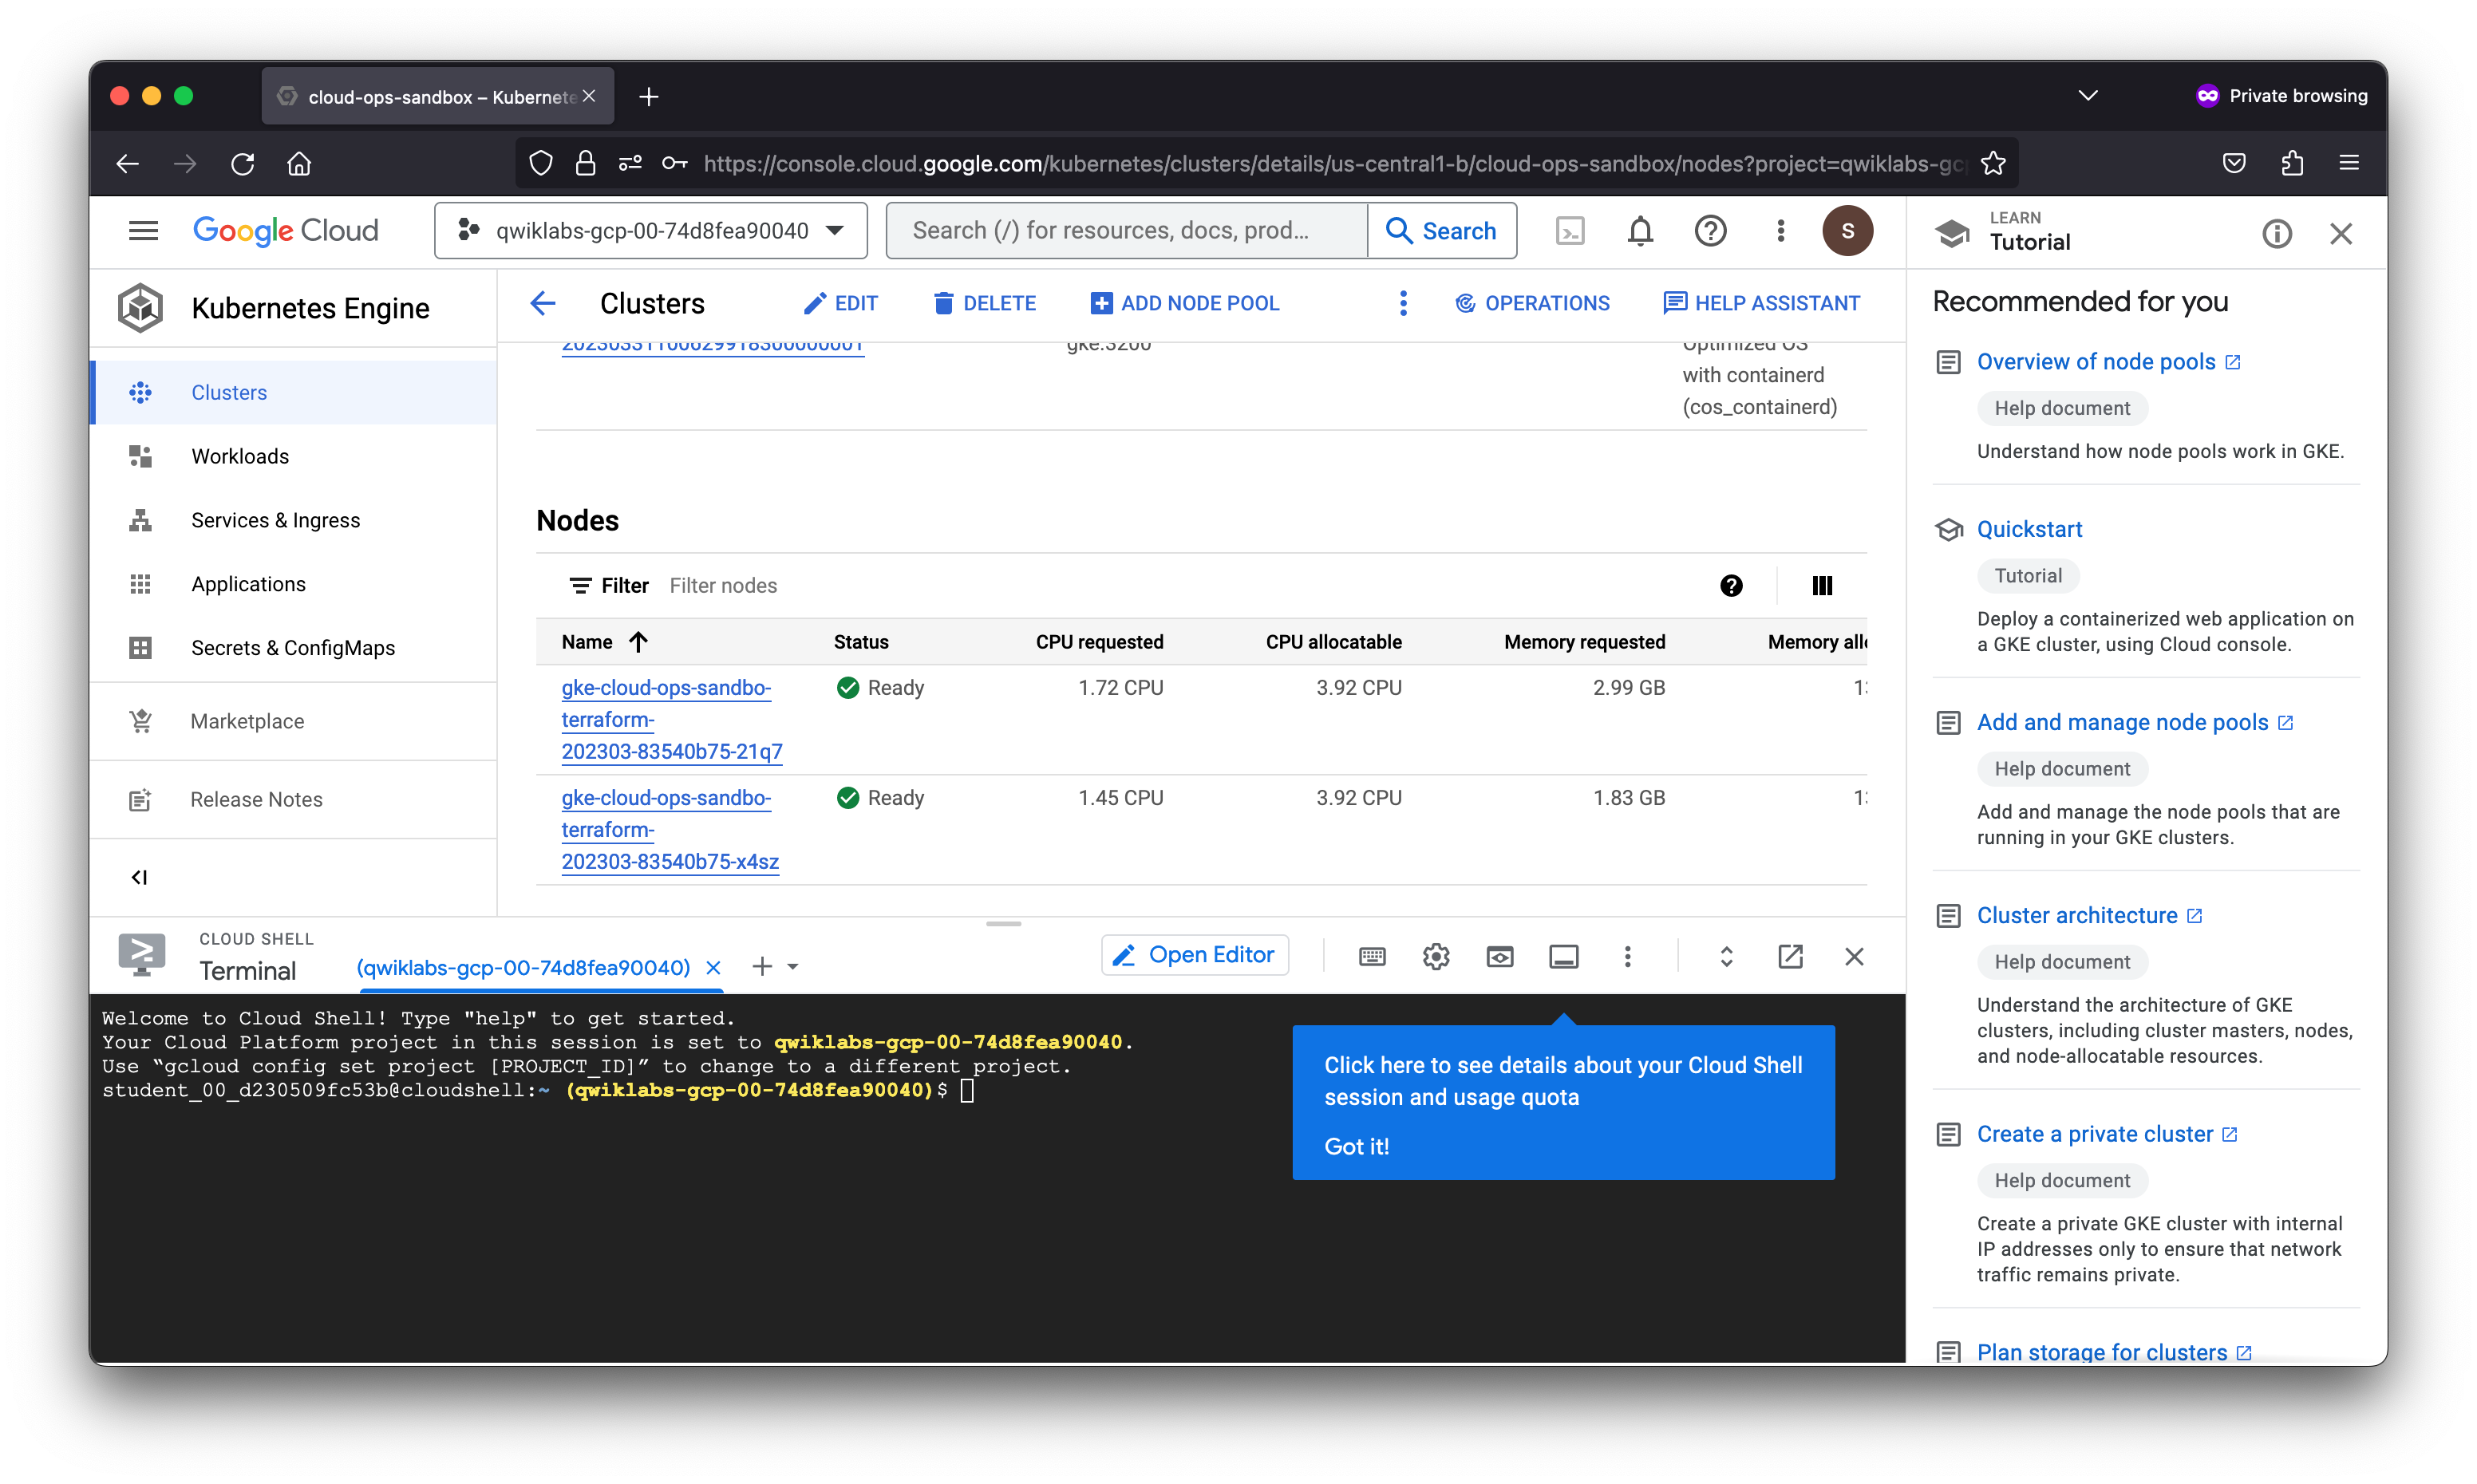
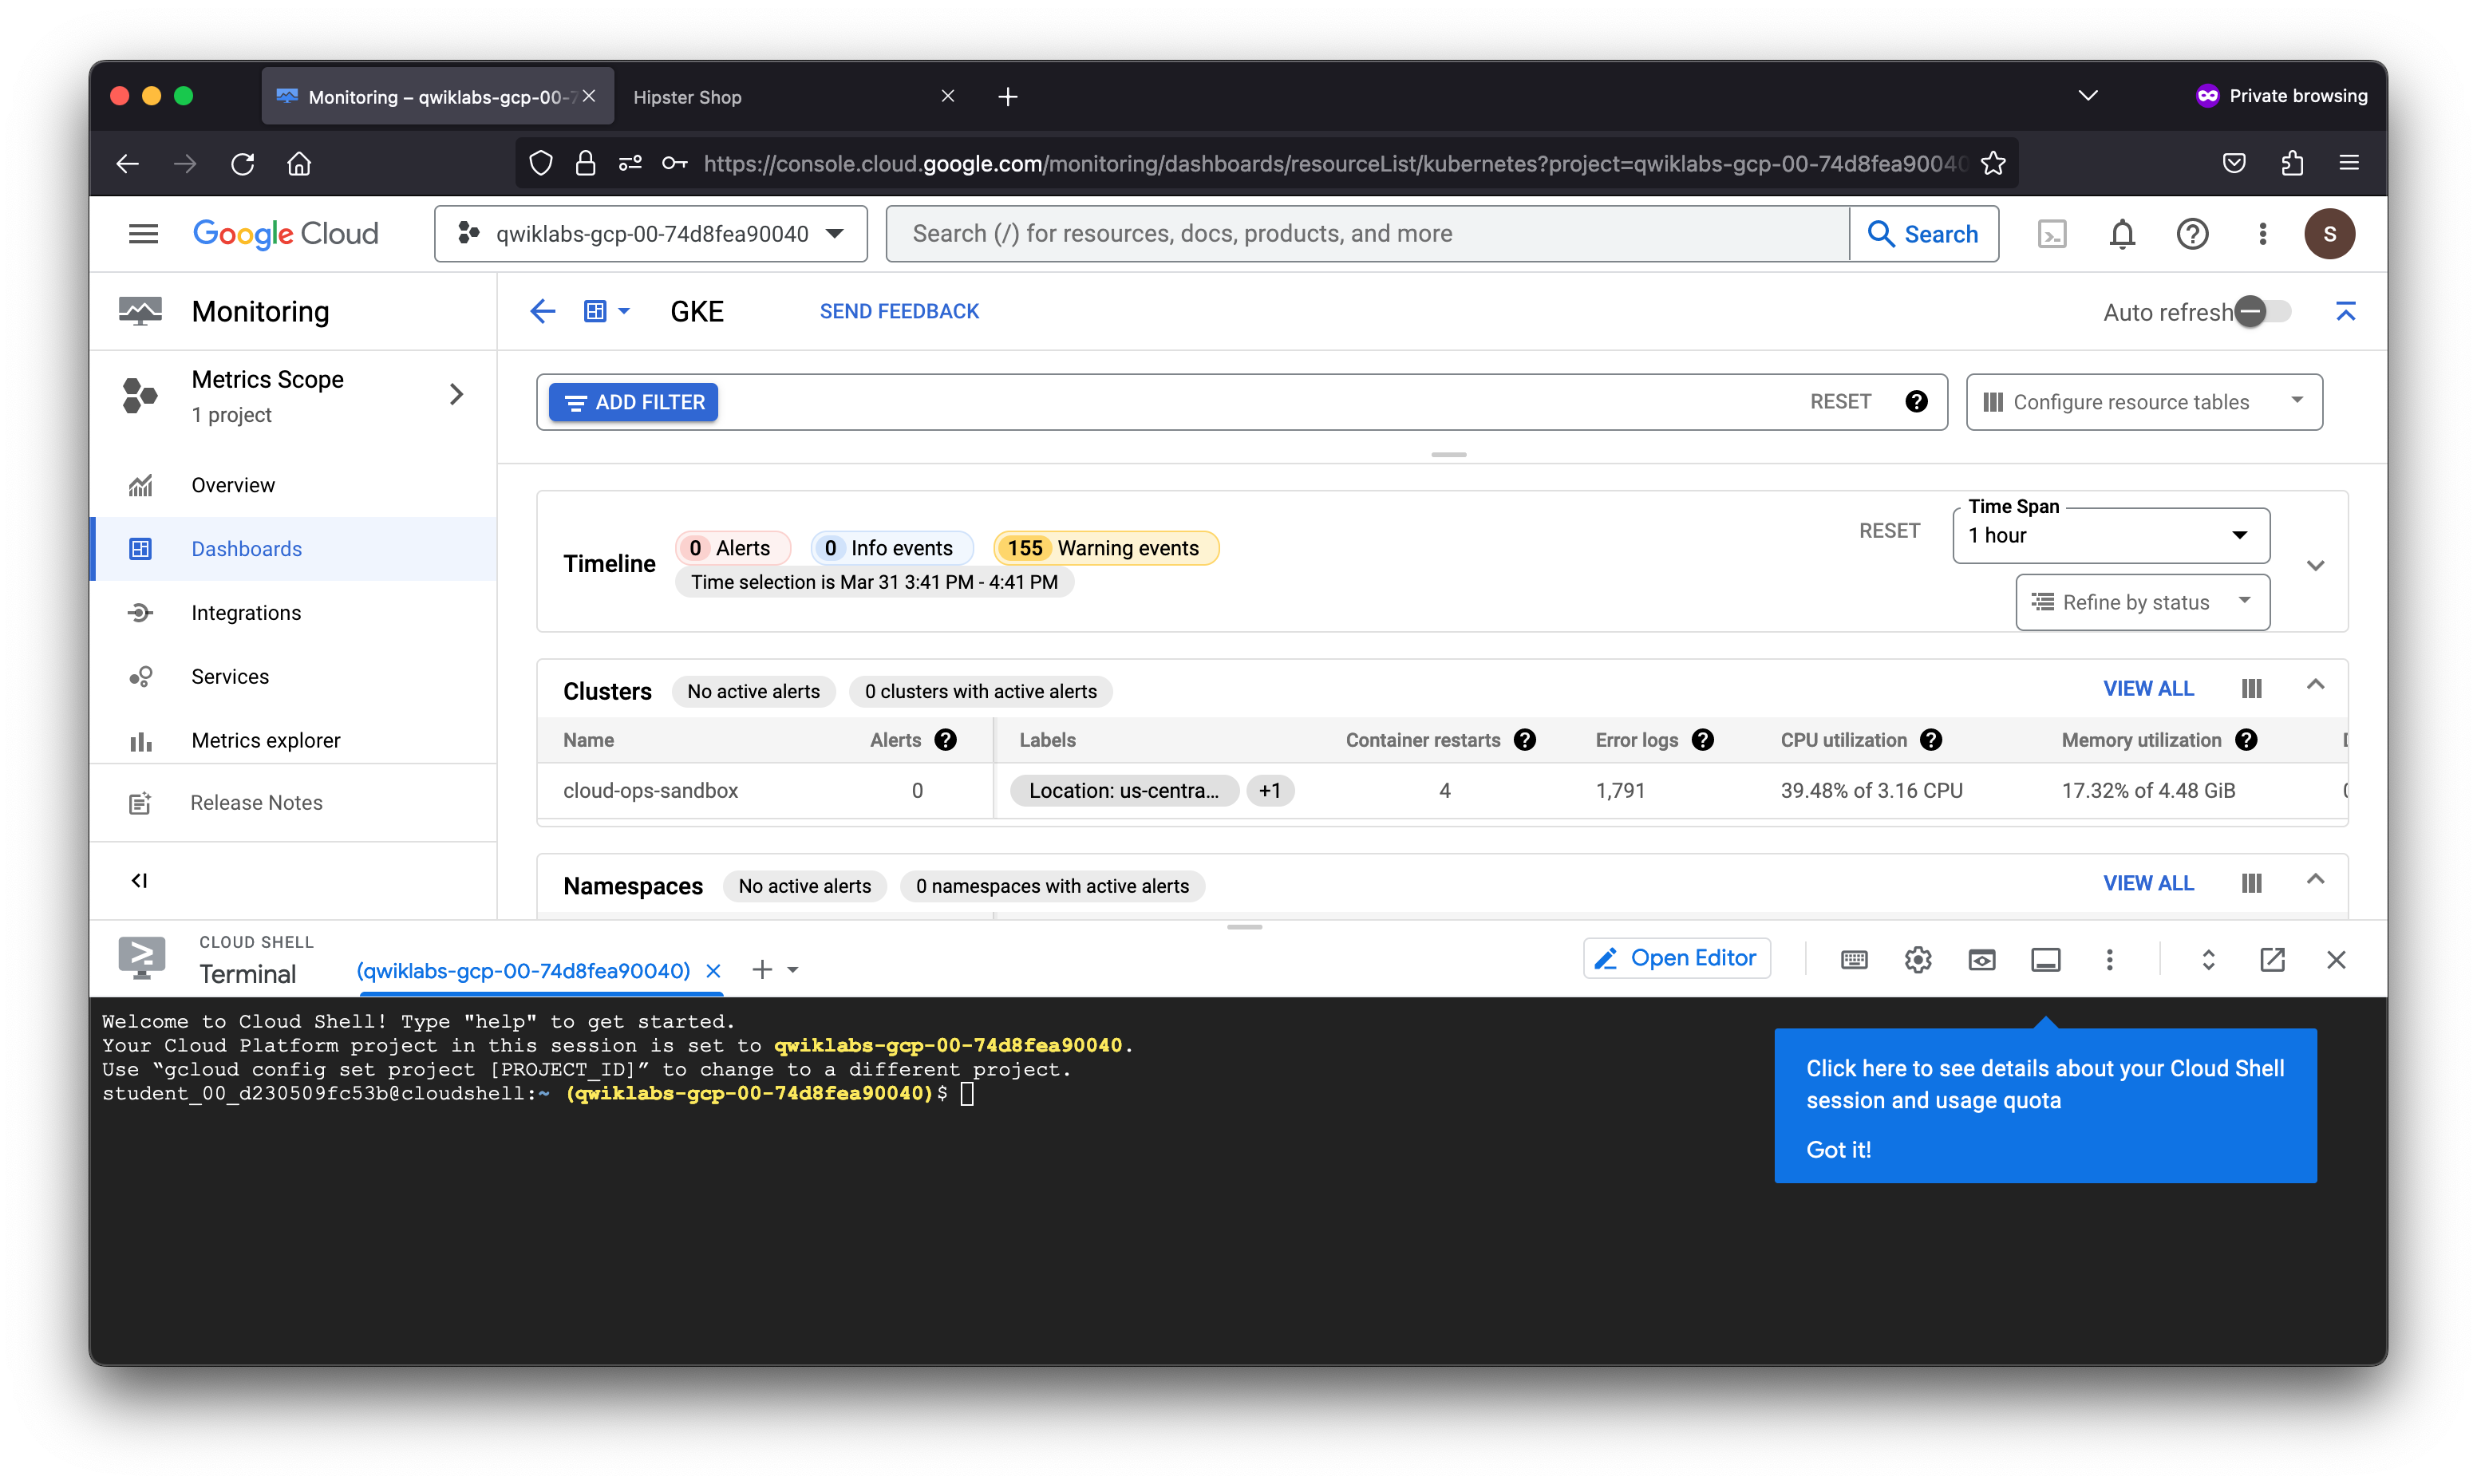
- Navigate resource pages of Google Kubernetes Engine (GKE)
- Leverage the GKE dashboard to quickly view operational data
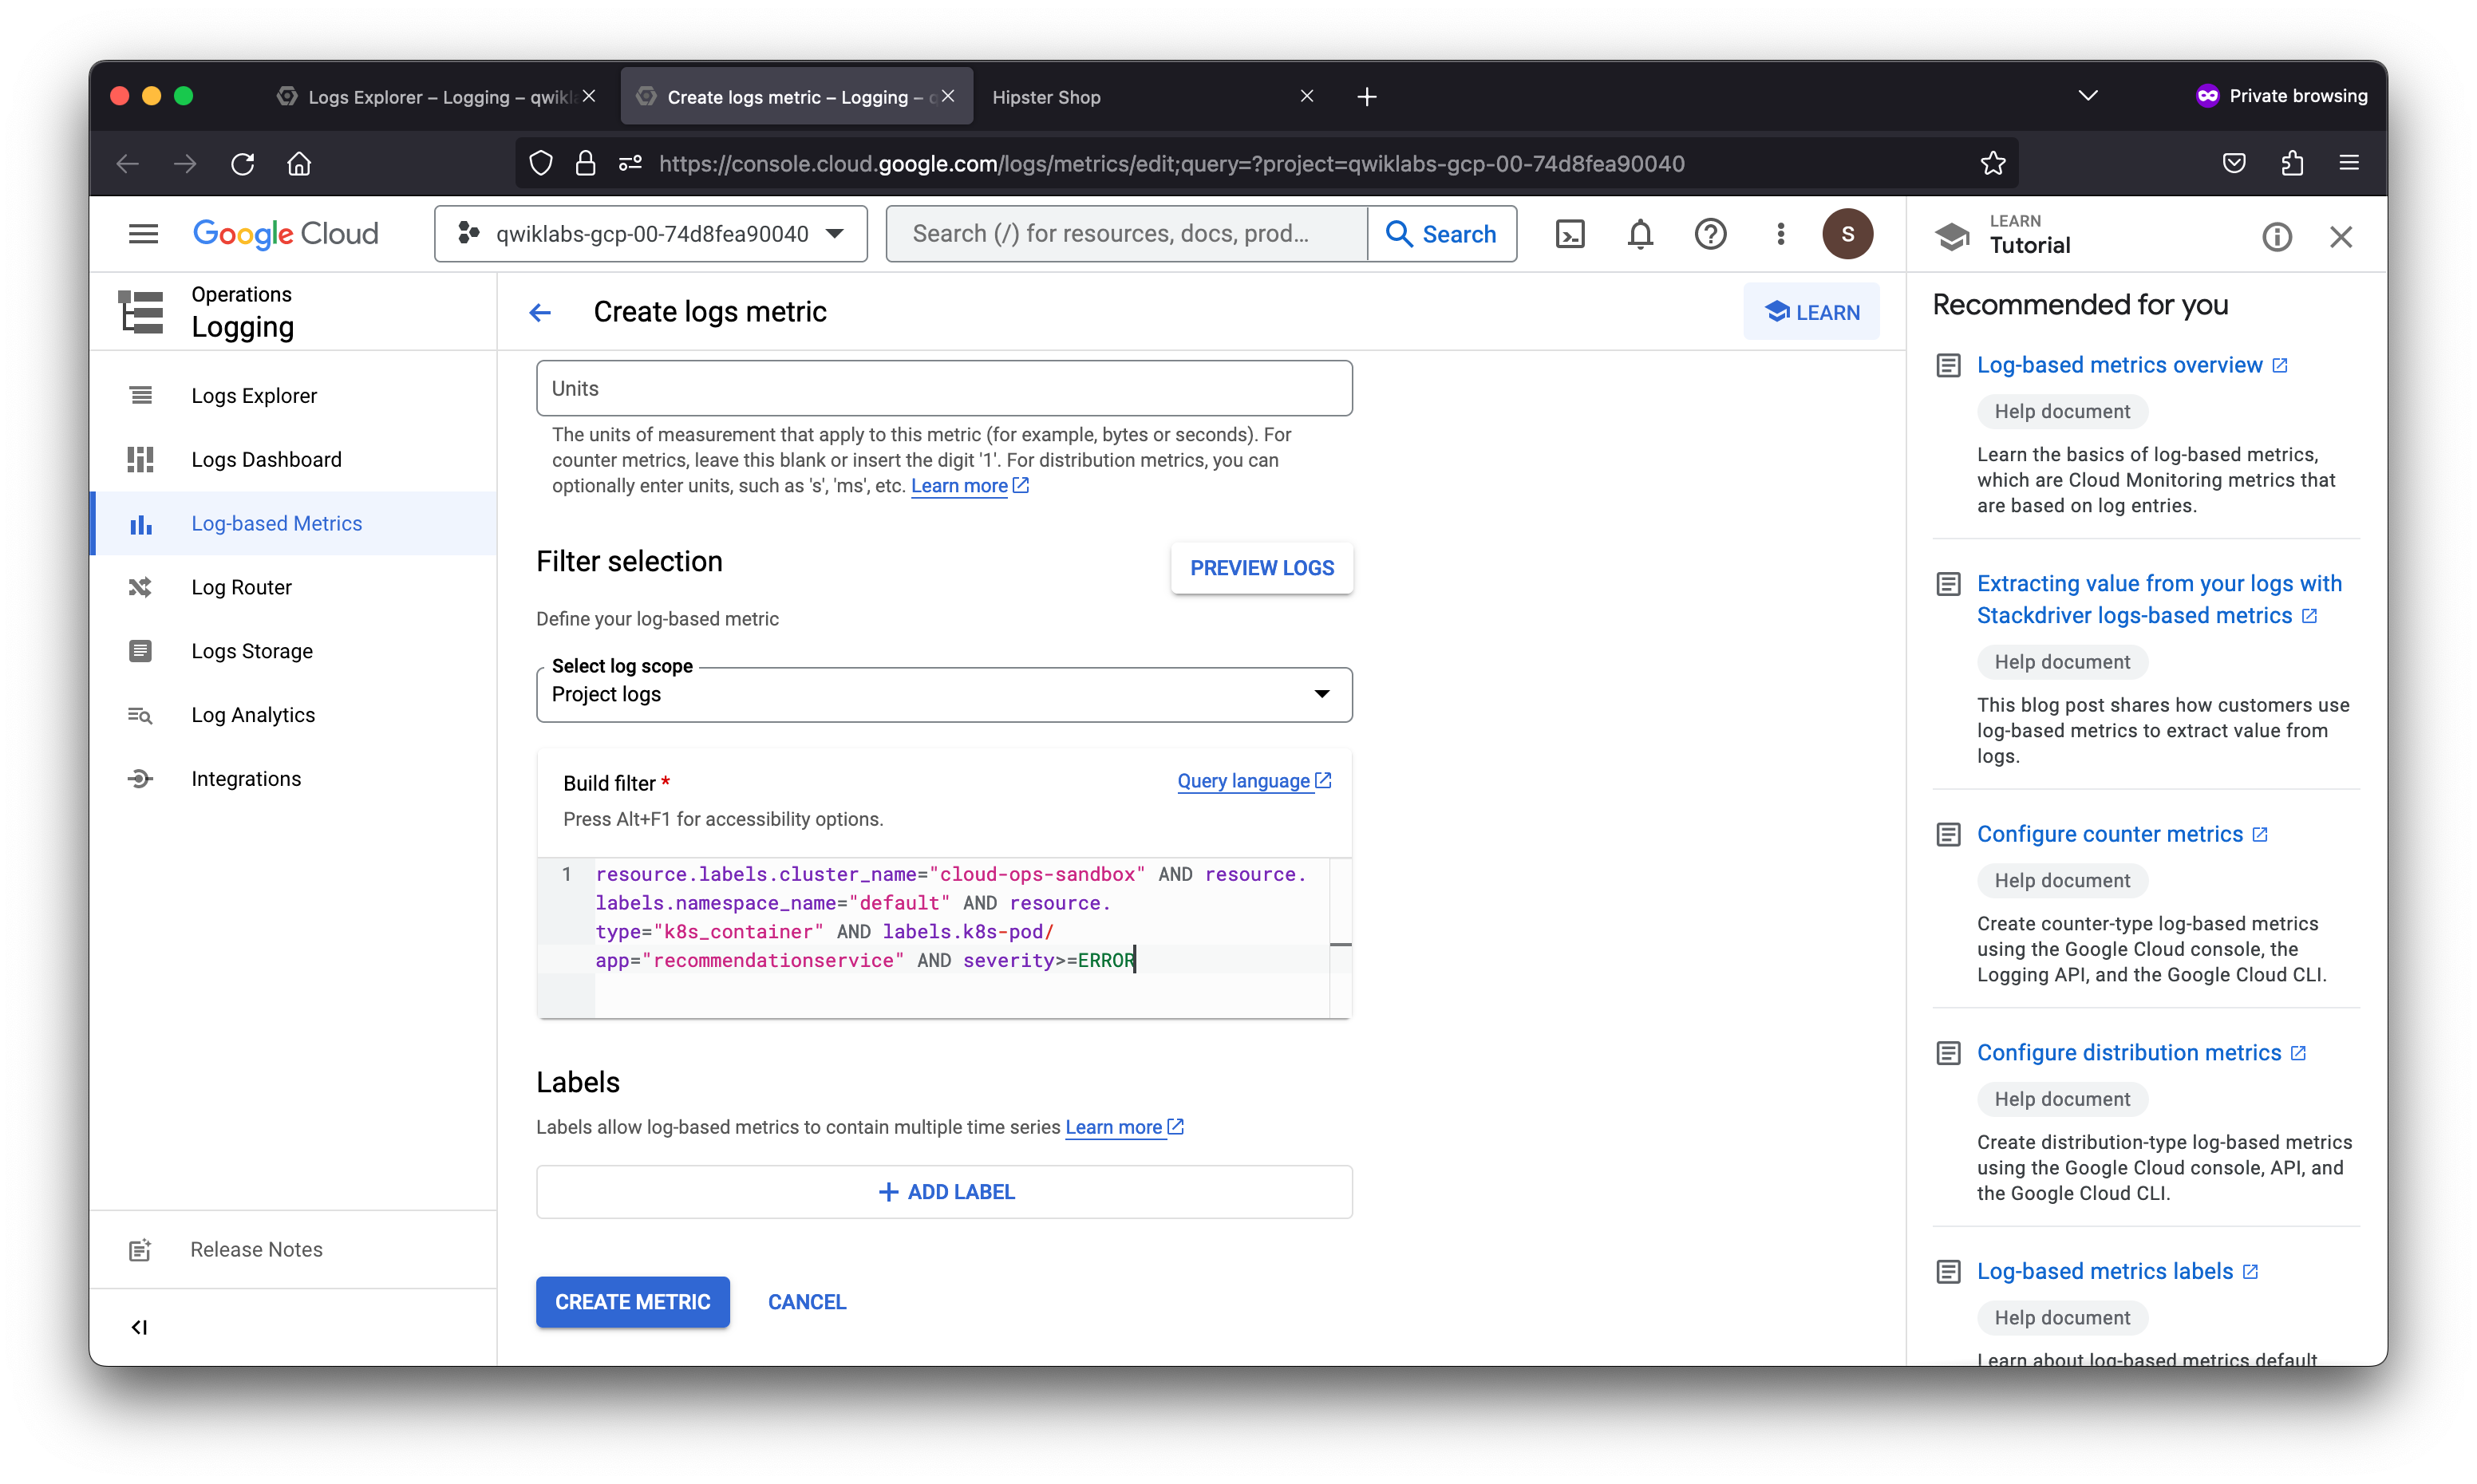
- Create logs-based metrics to capture specific issues
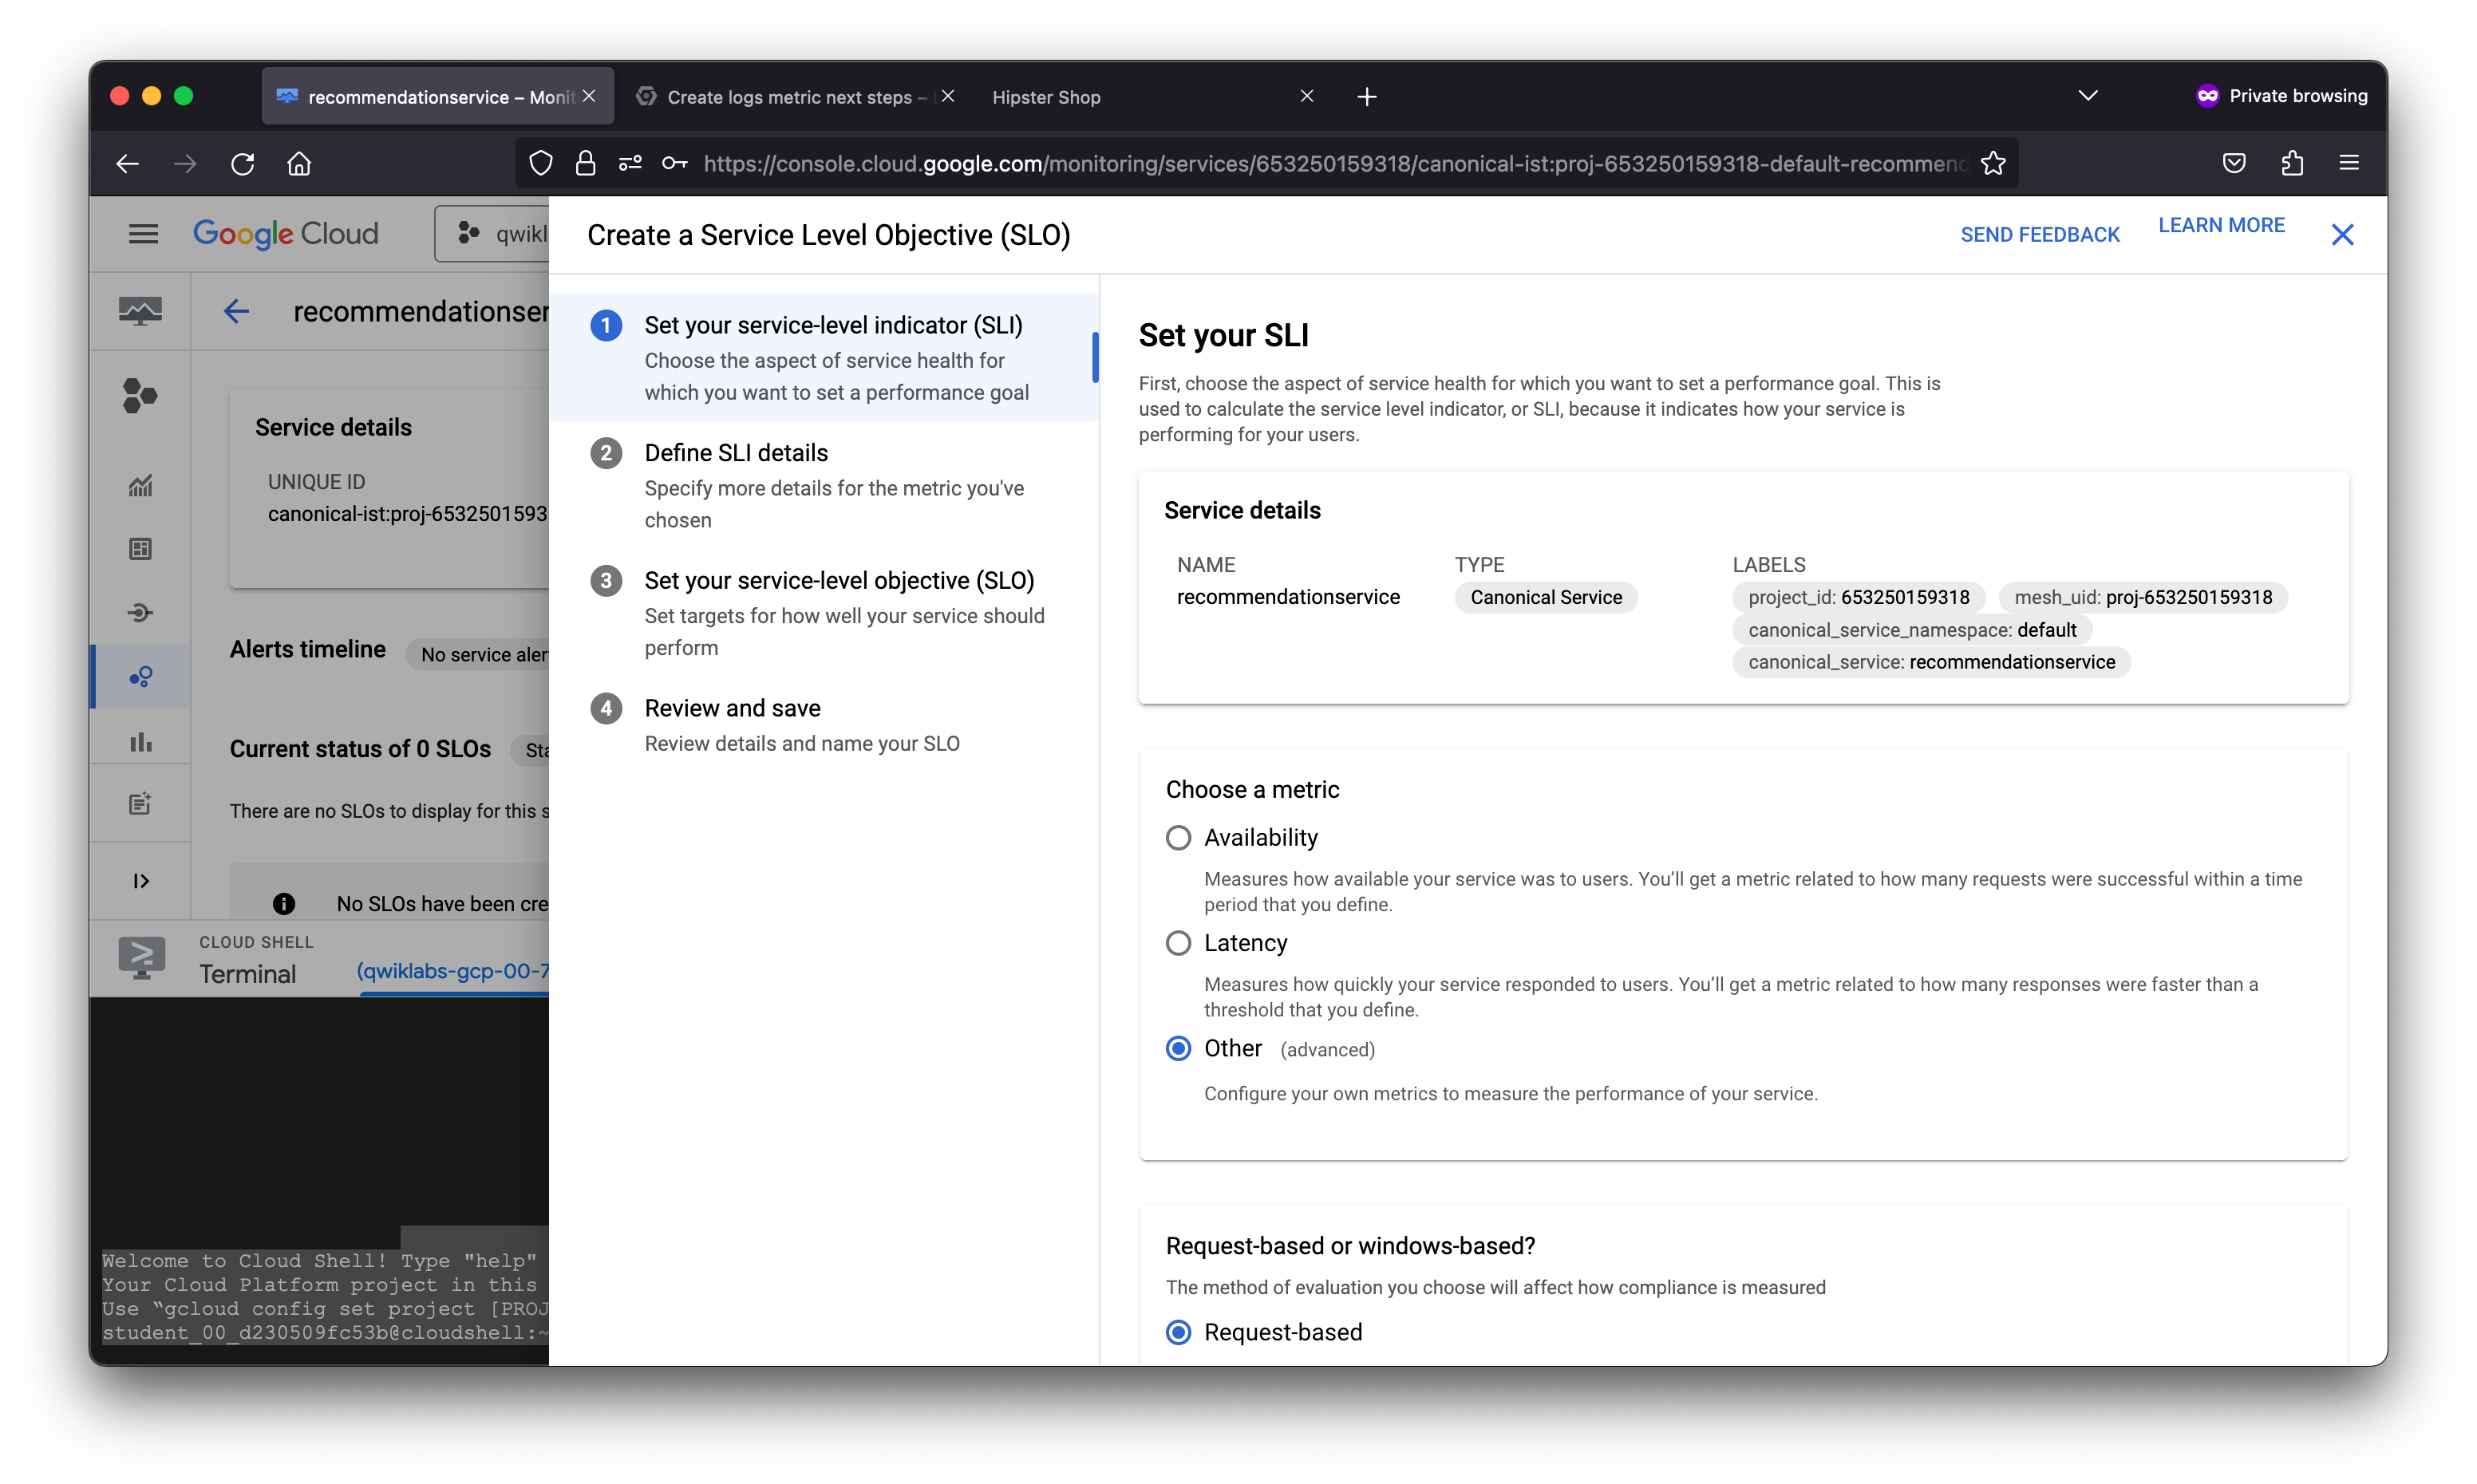
- Create a Service Level Objective (SLO)
- Define an Alert to notify SRE staff of incidents
Scenario
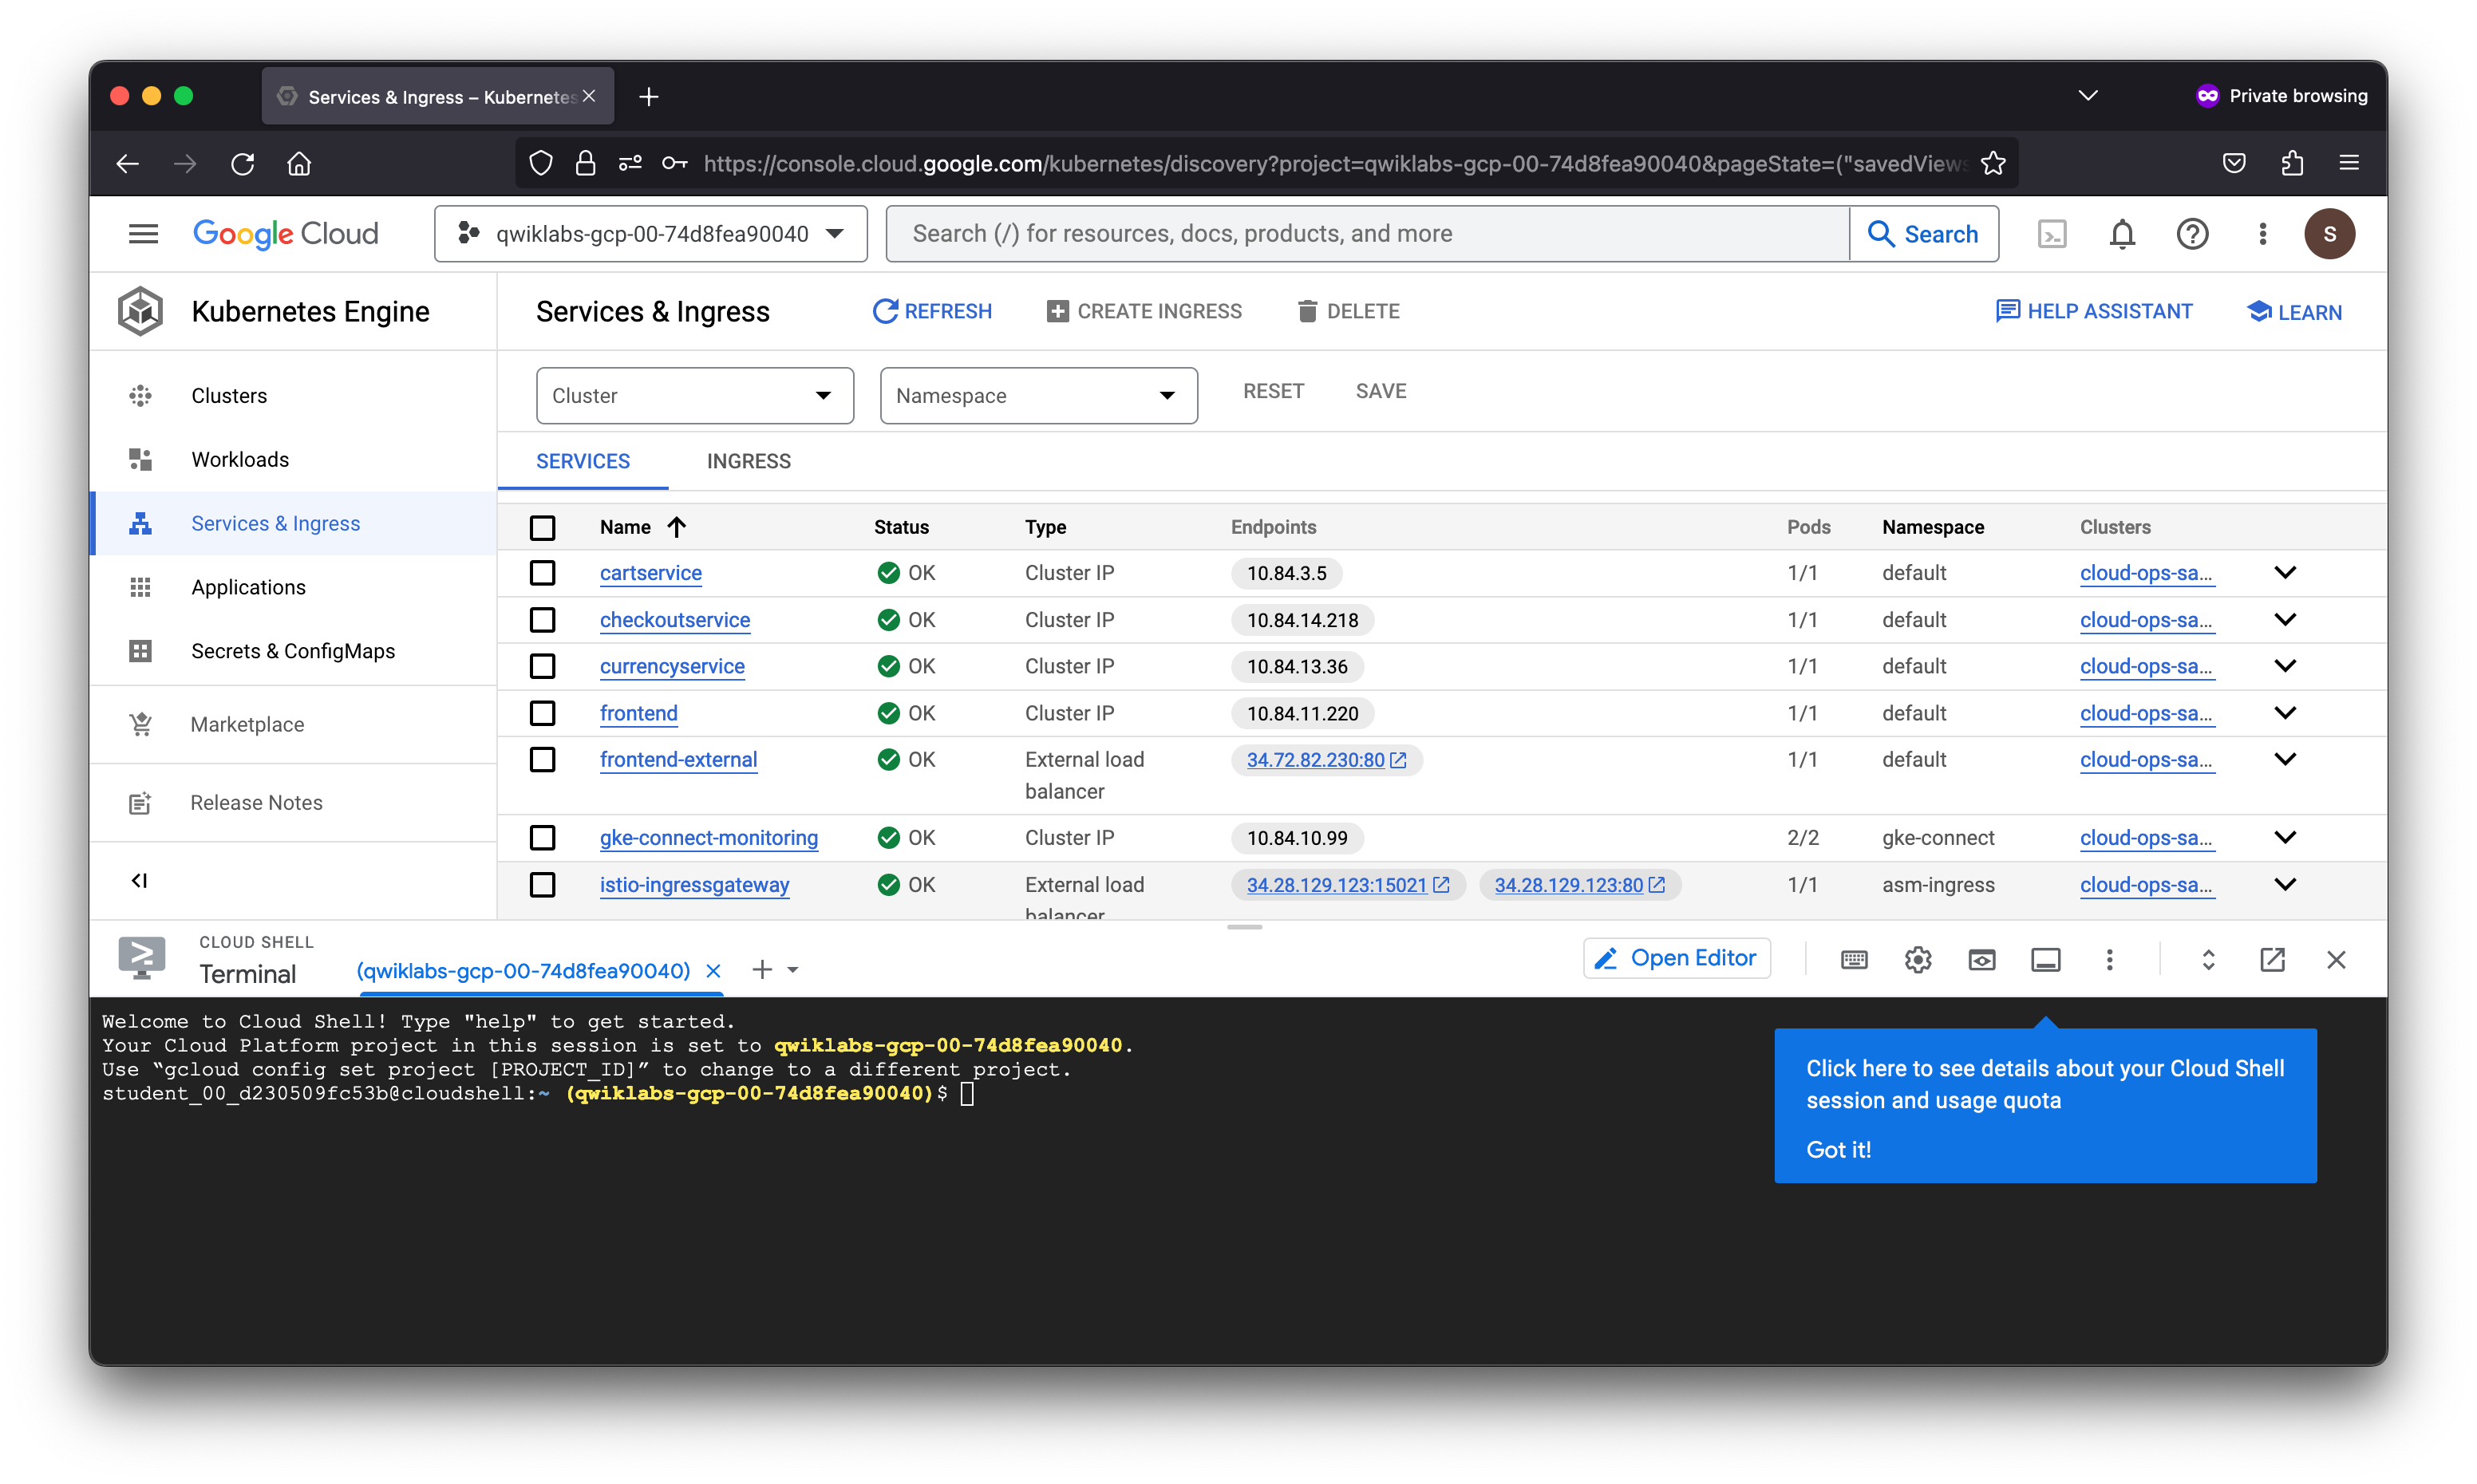
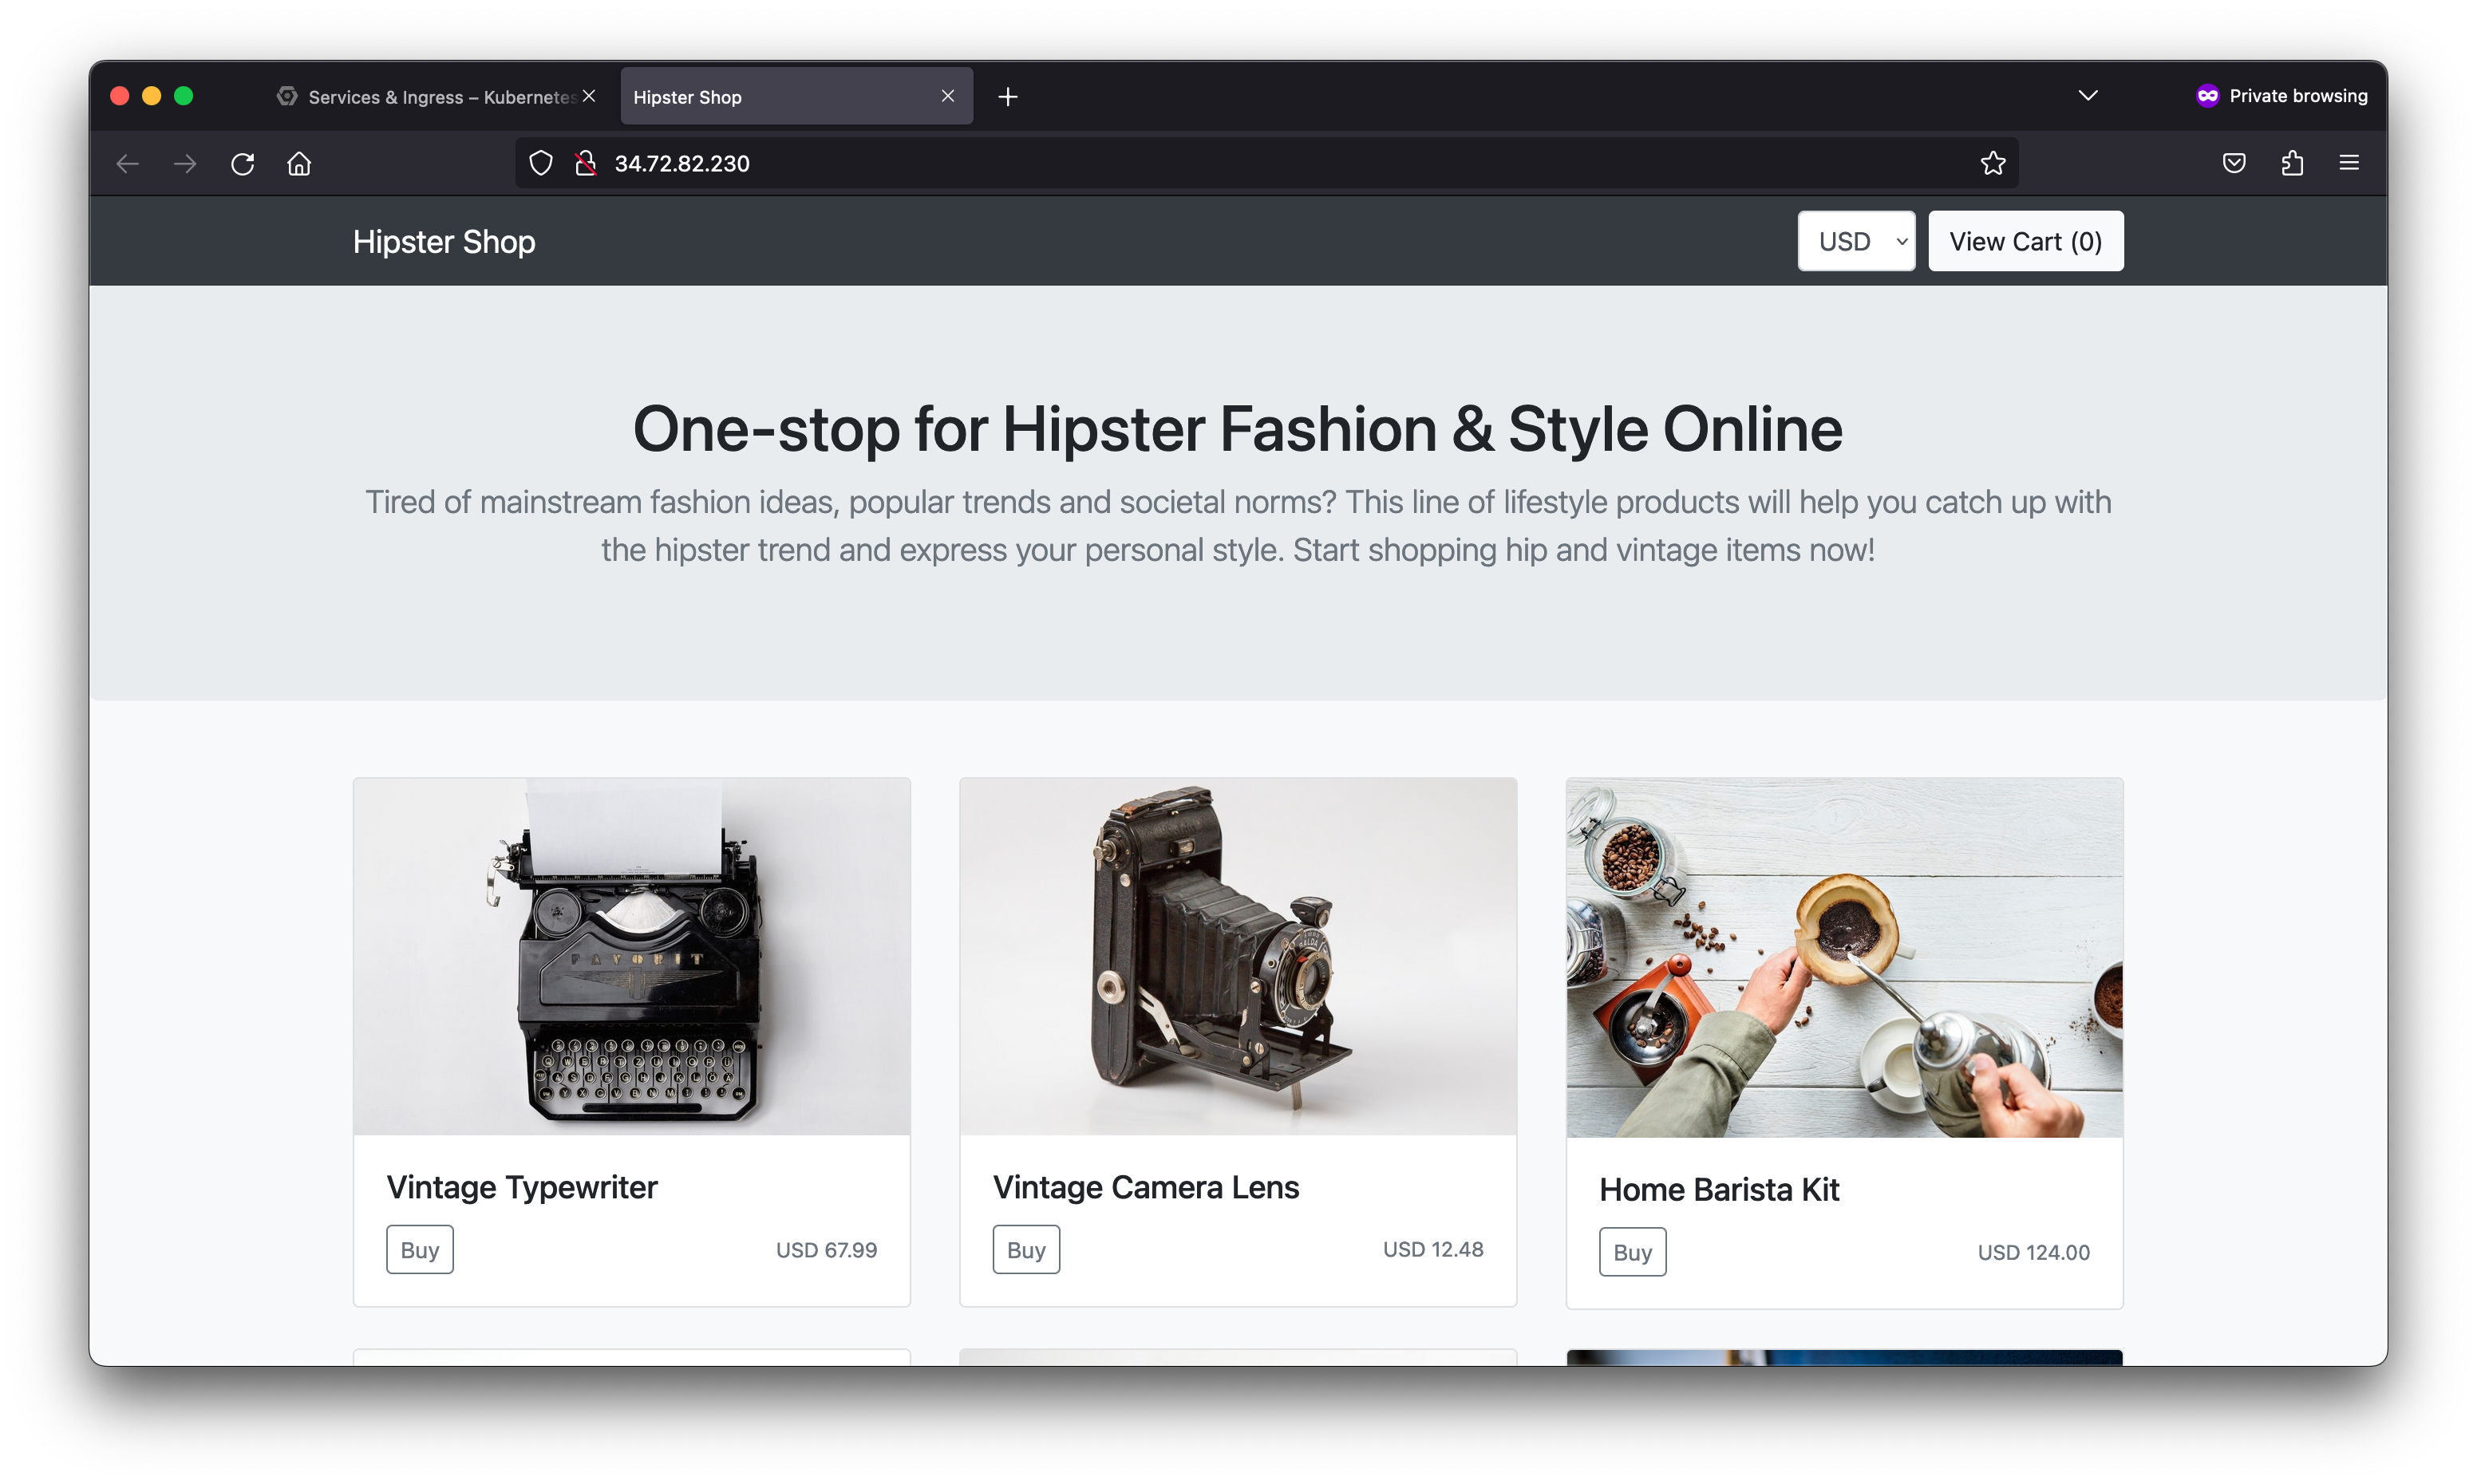
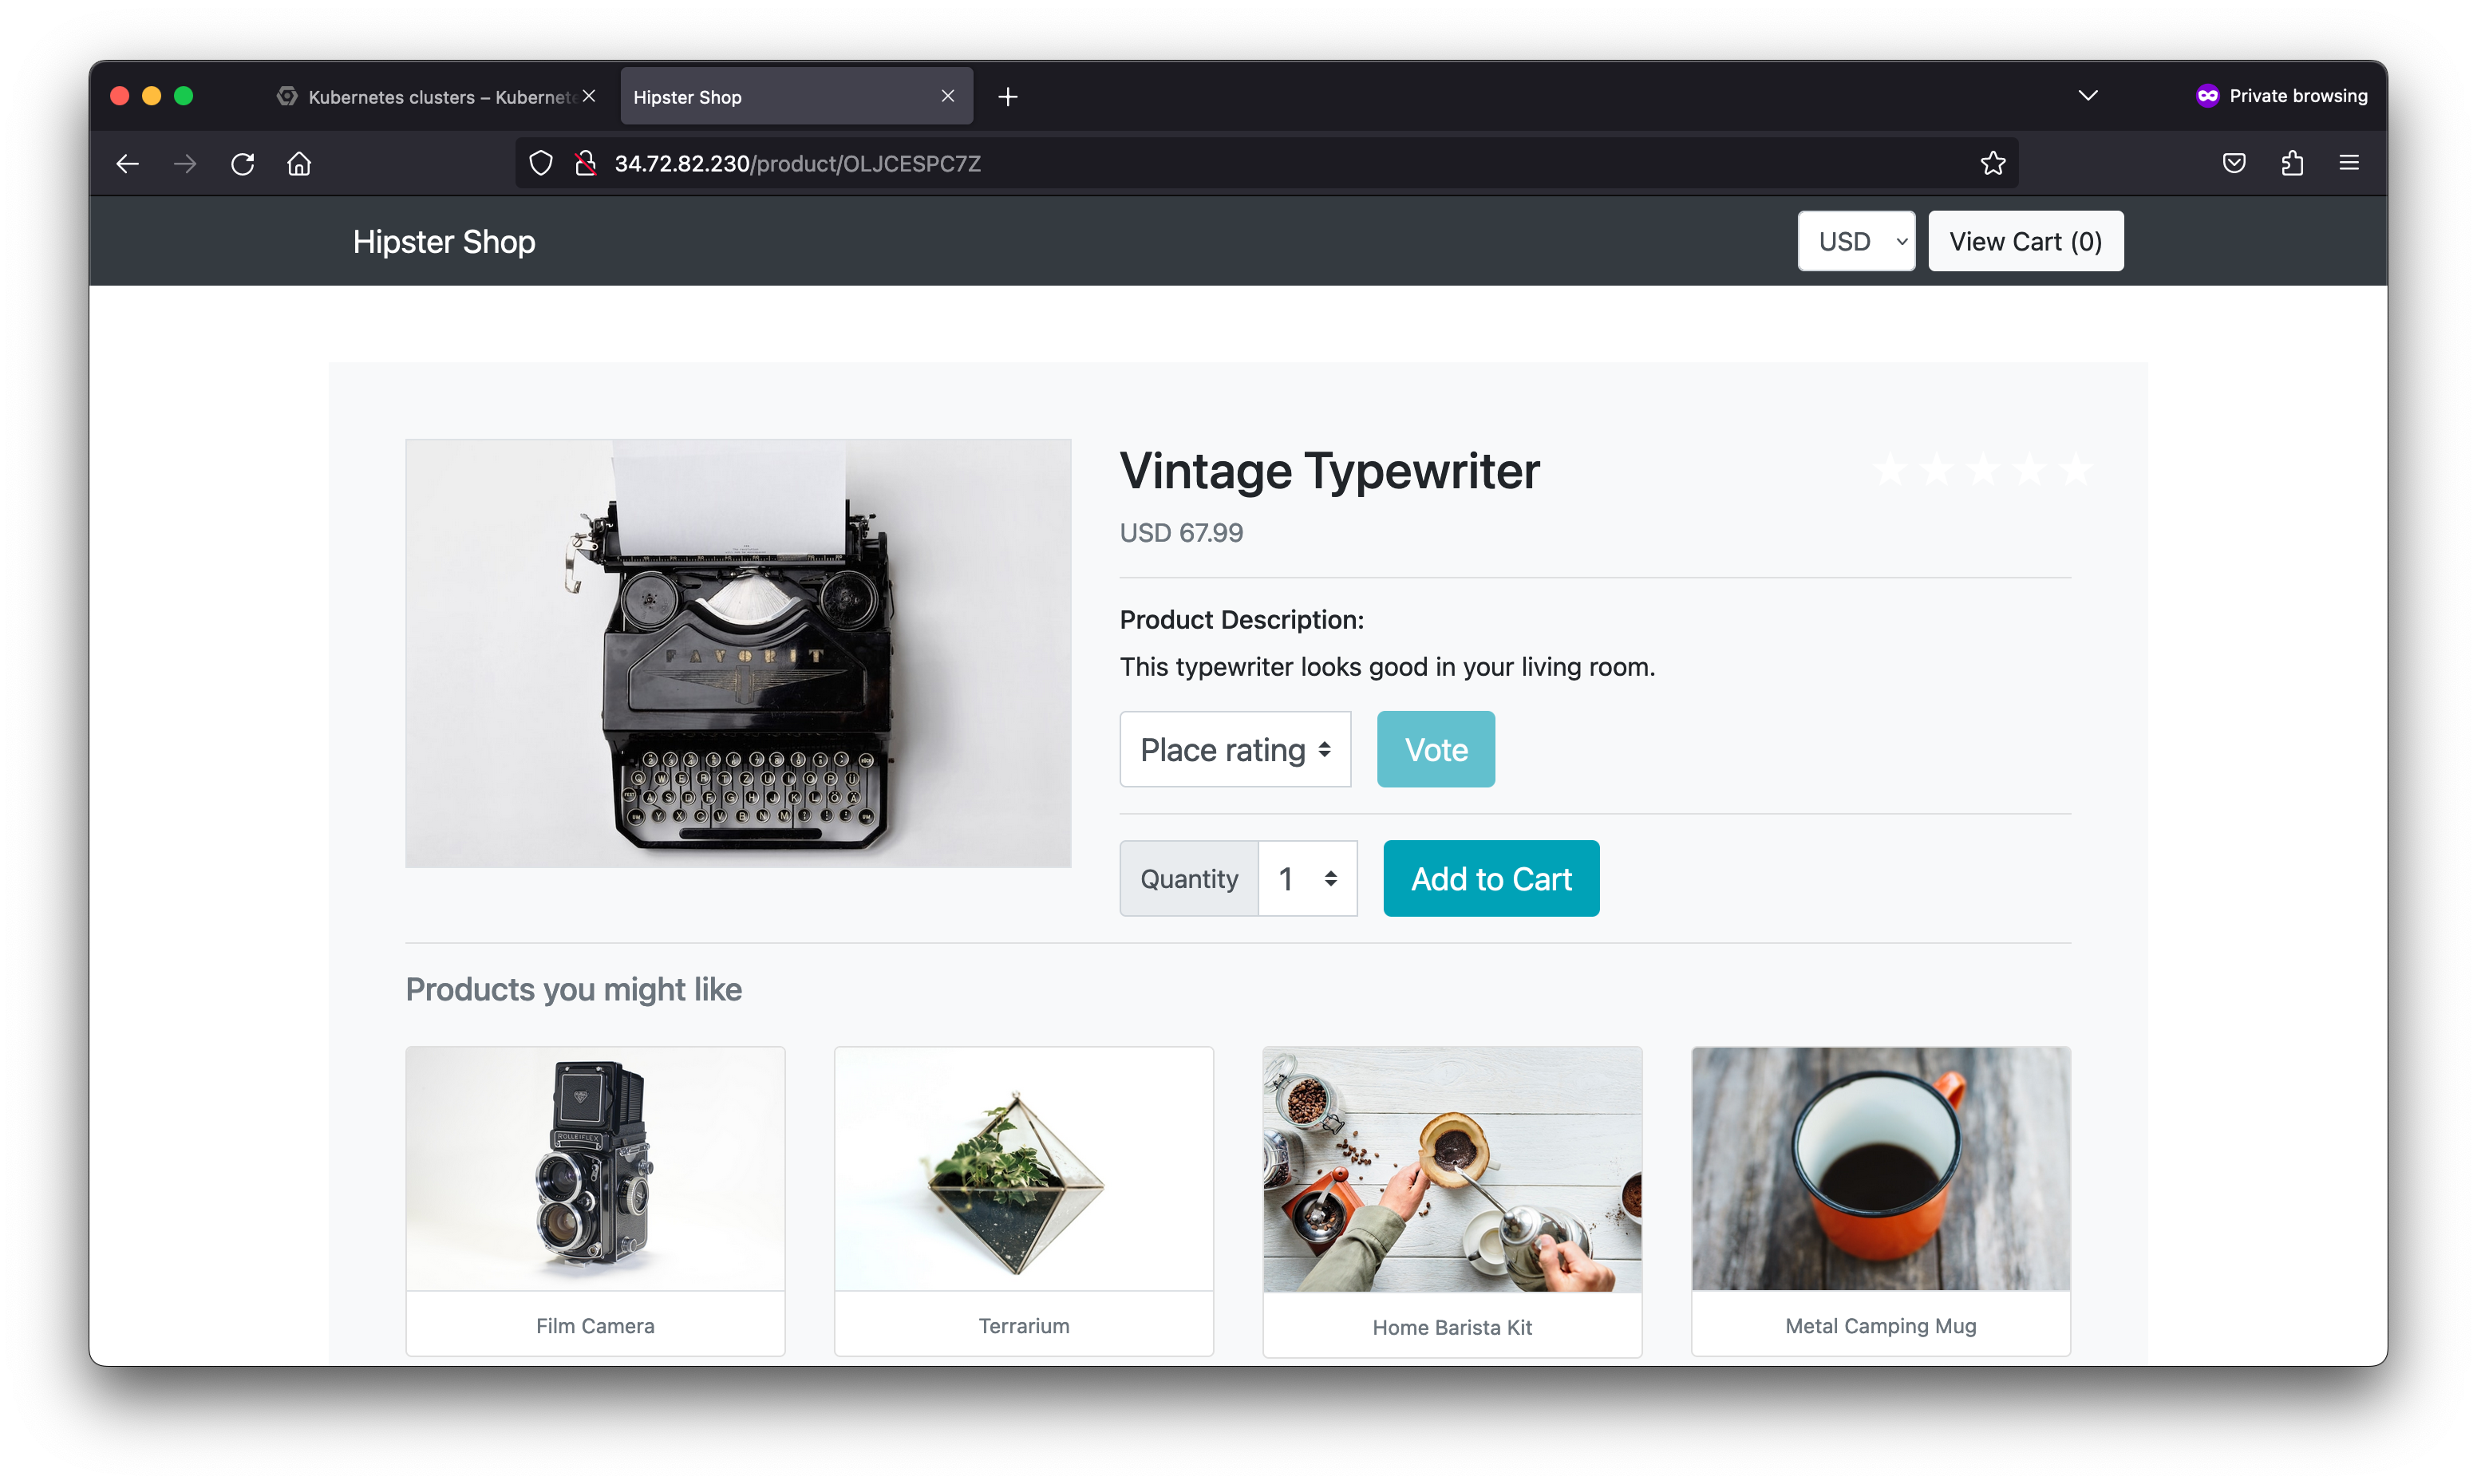
Your organization has deployed a multi-tier microservices application. It is a web-based e-commerce application called “Hipster Shop”, where users can browse for vintage items, add them to their cart and purchase them. Hipster Shop is composed of many microservices, written in different languages, that communicate via gRPC and REST APIs. The architecture of the deployment is optimized for learning purposes and includes modern technologies as part of the stack: Kubernetes, Istio, Cloud Operations, App Engine, gRPC, OpenTelemetry, and similar cloud-native technologies.
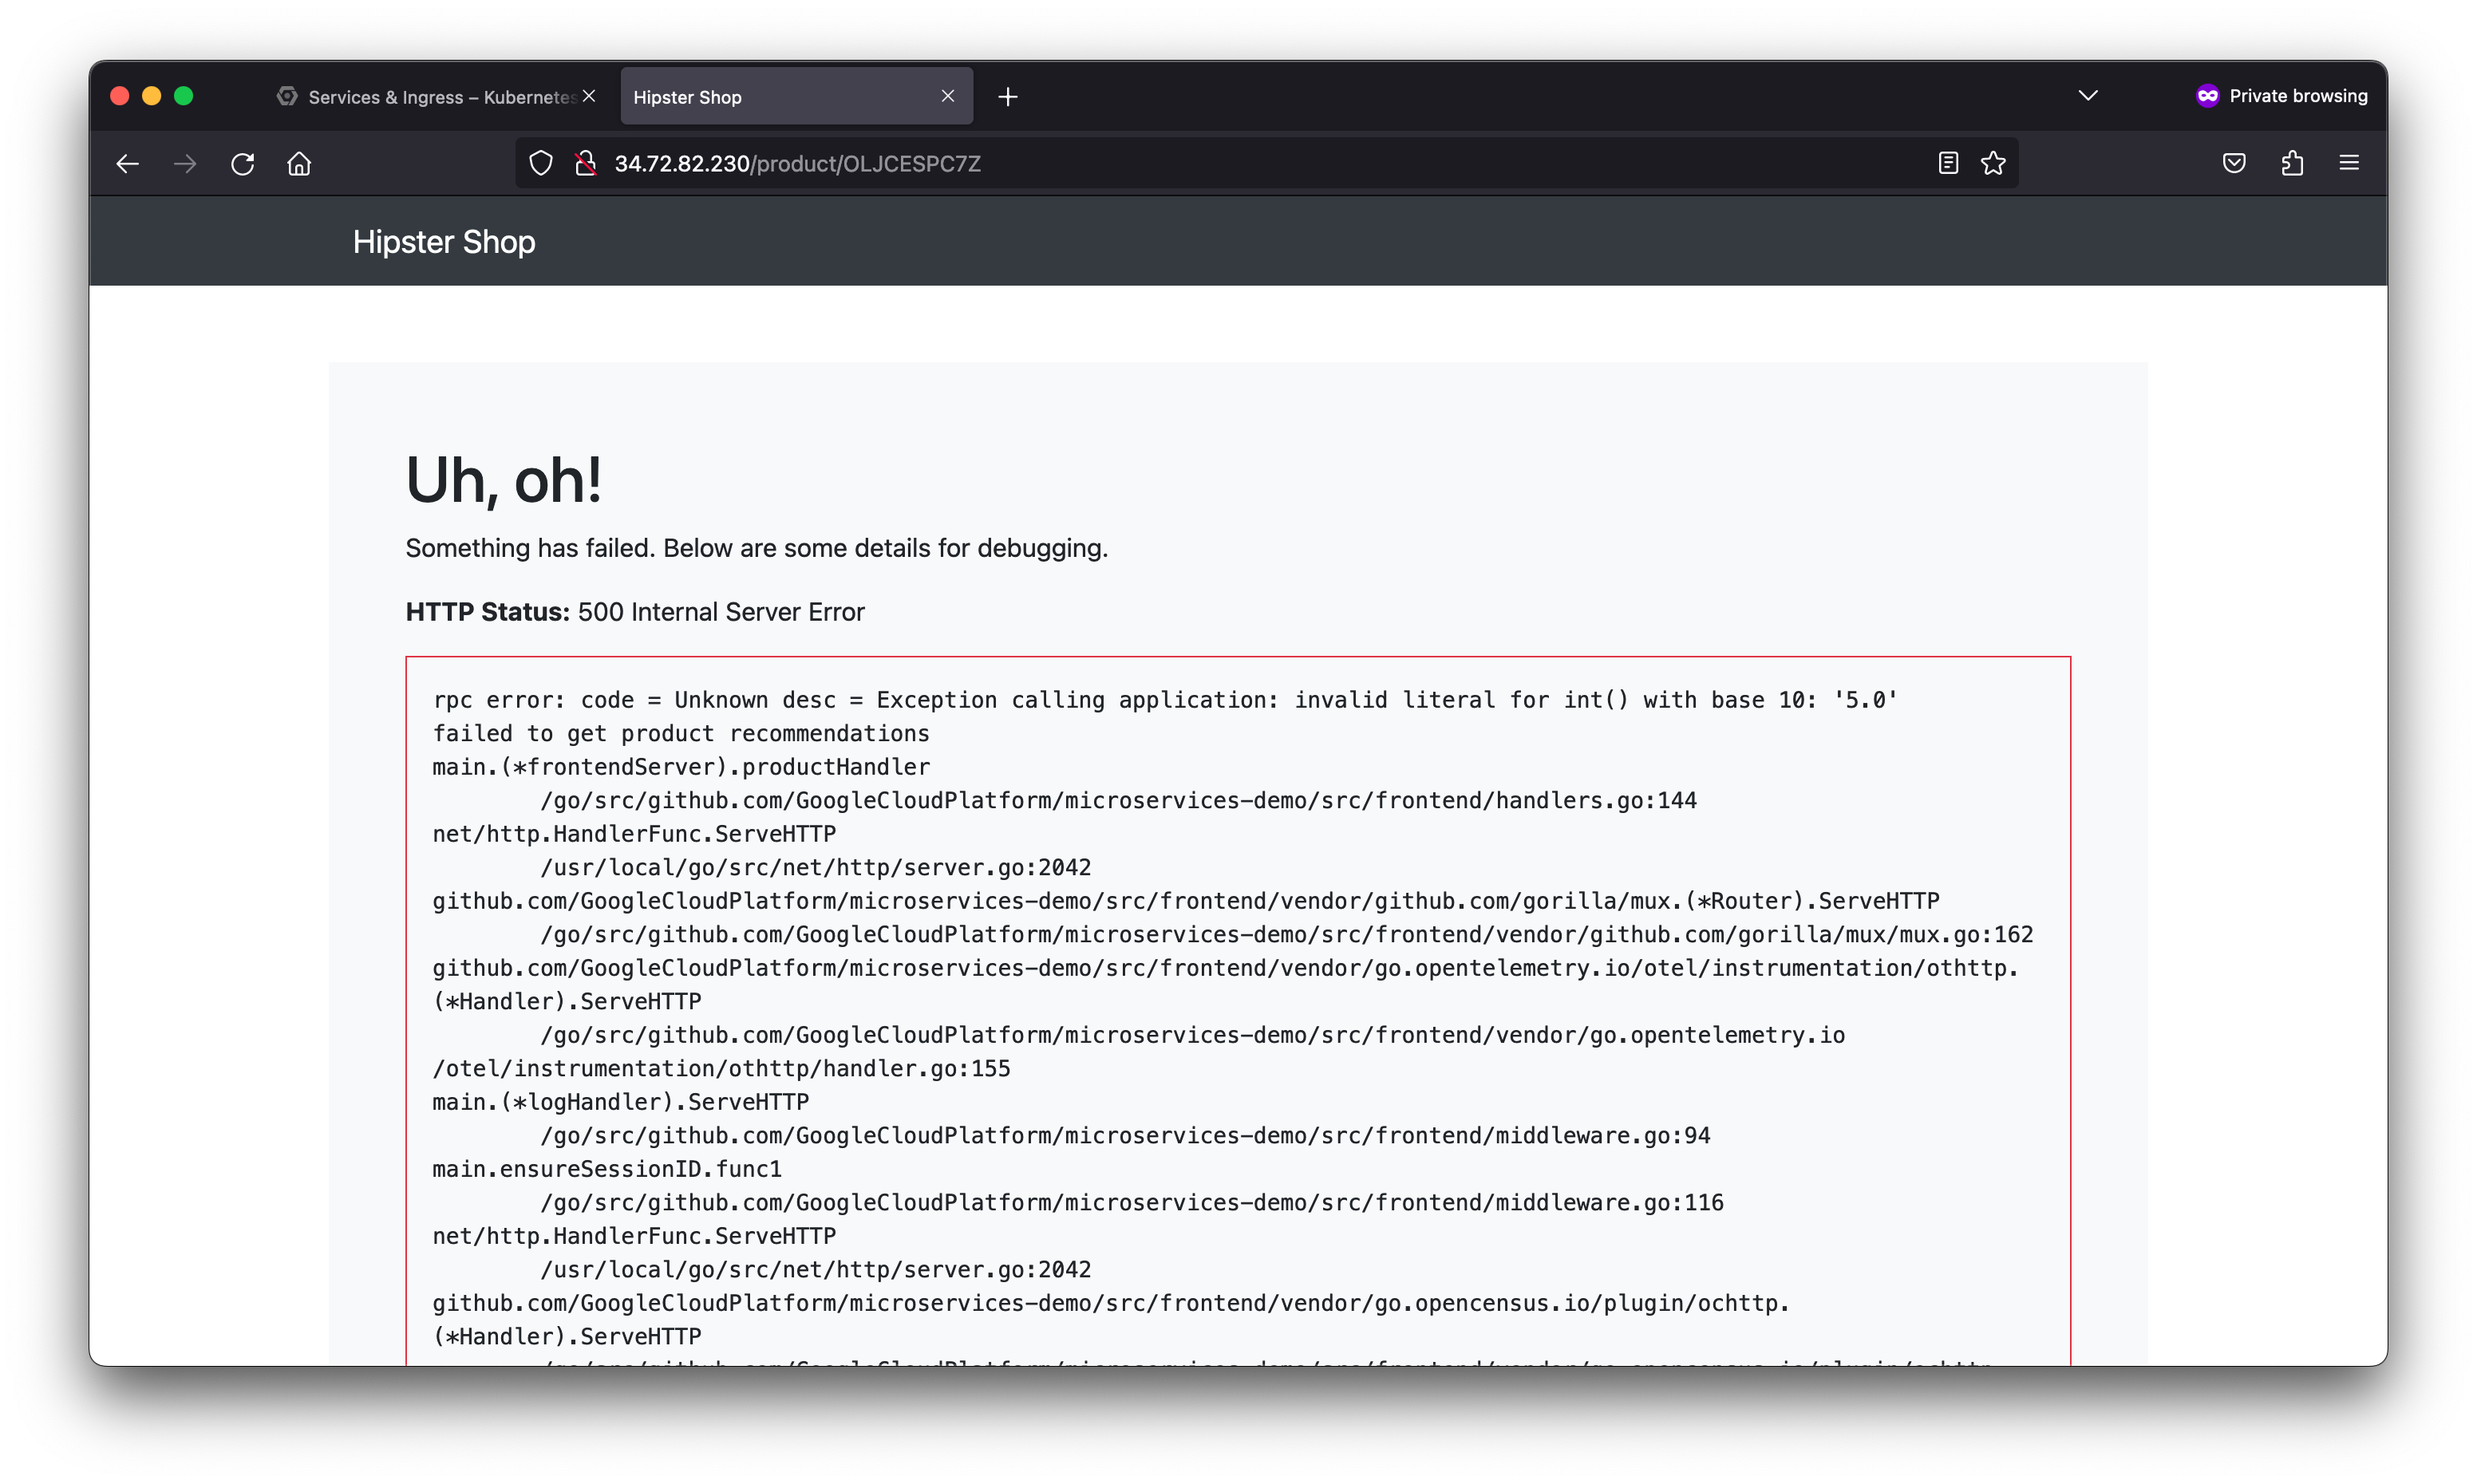
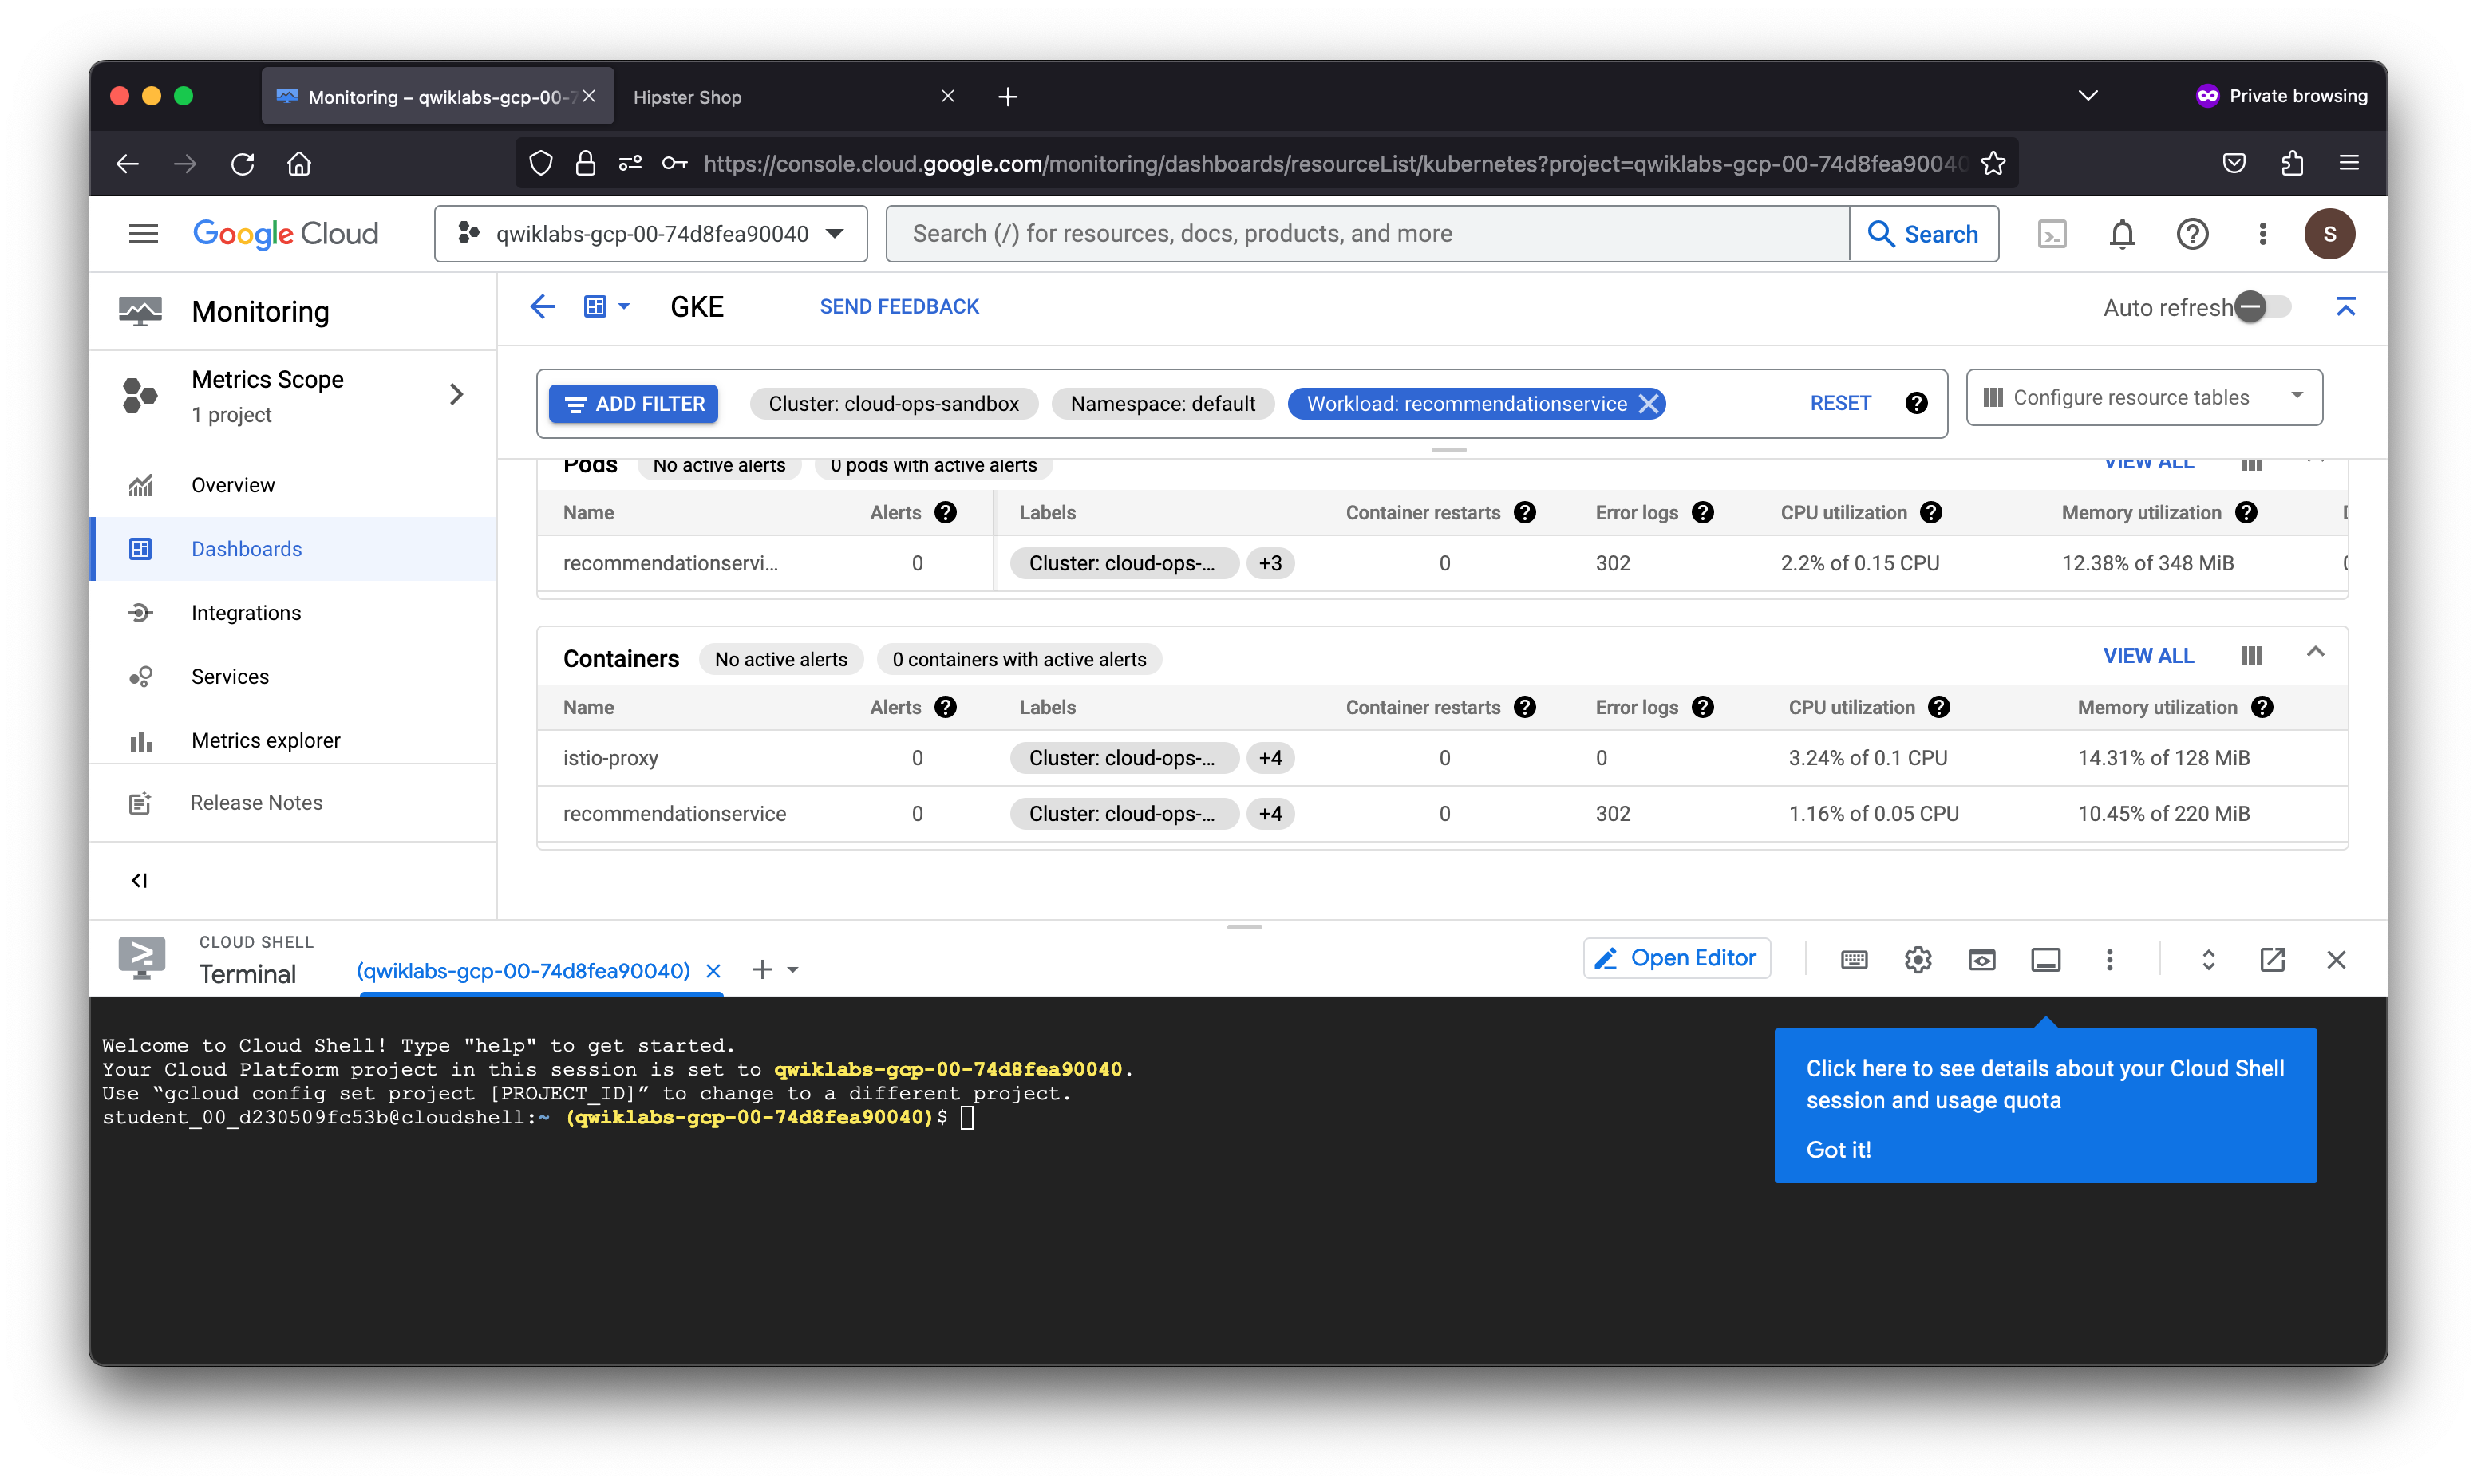
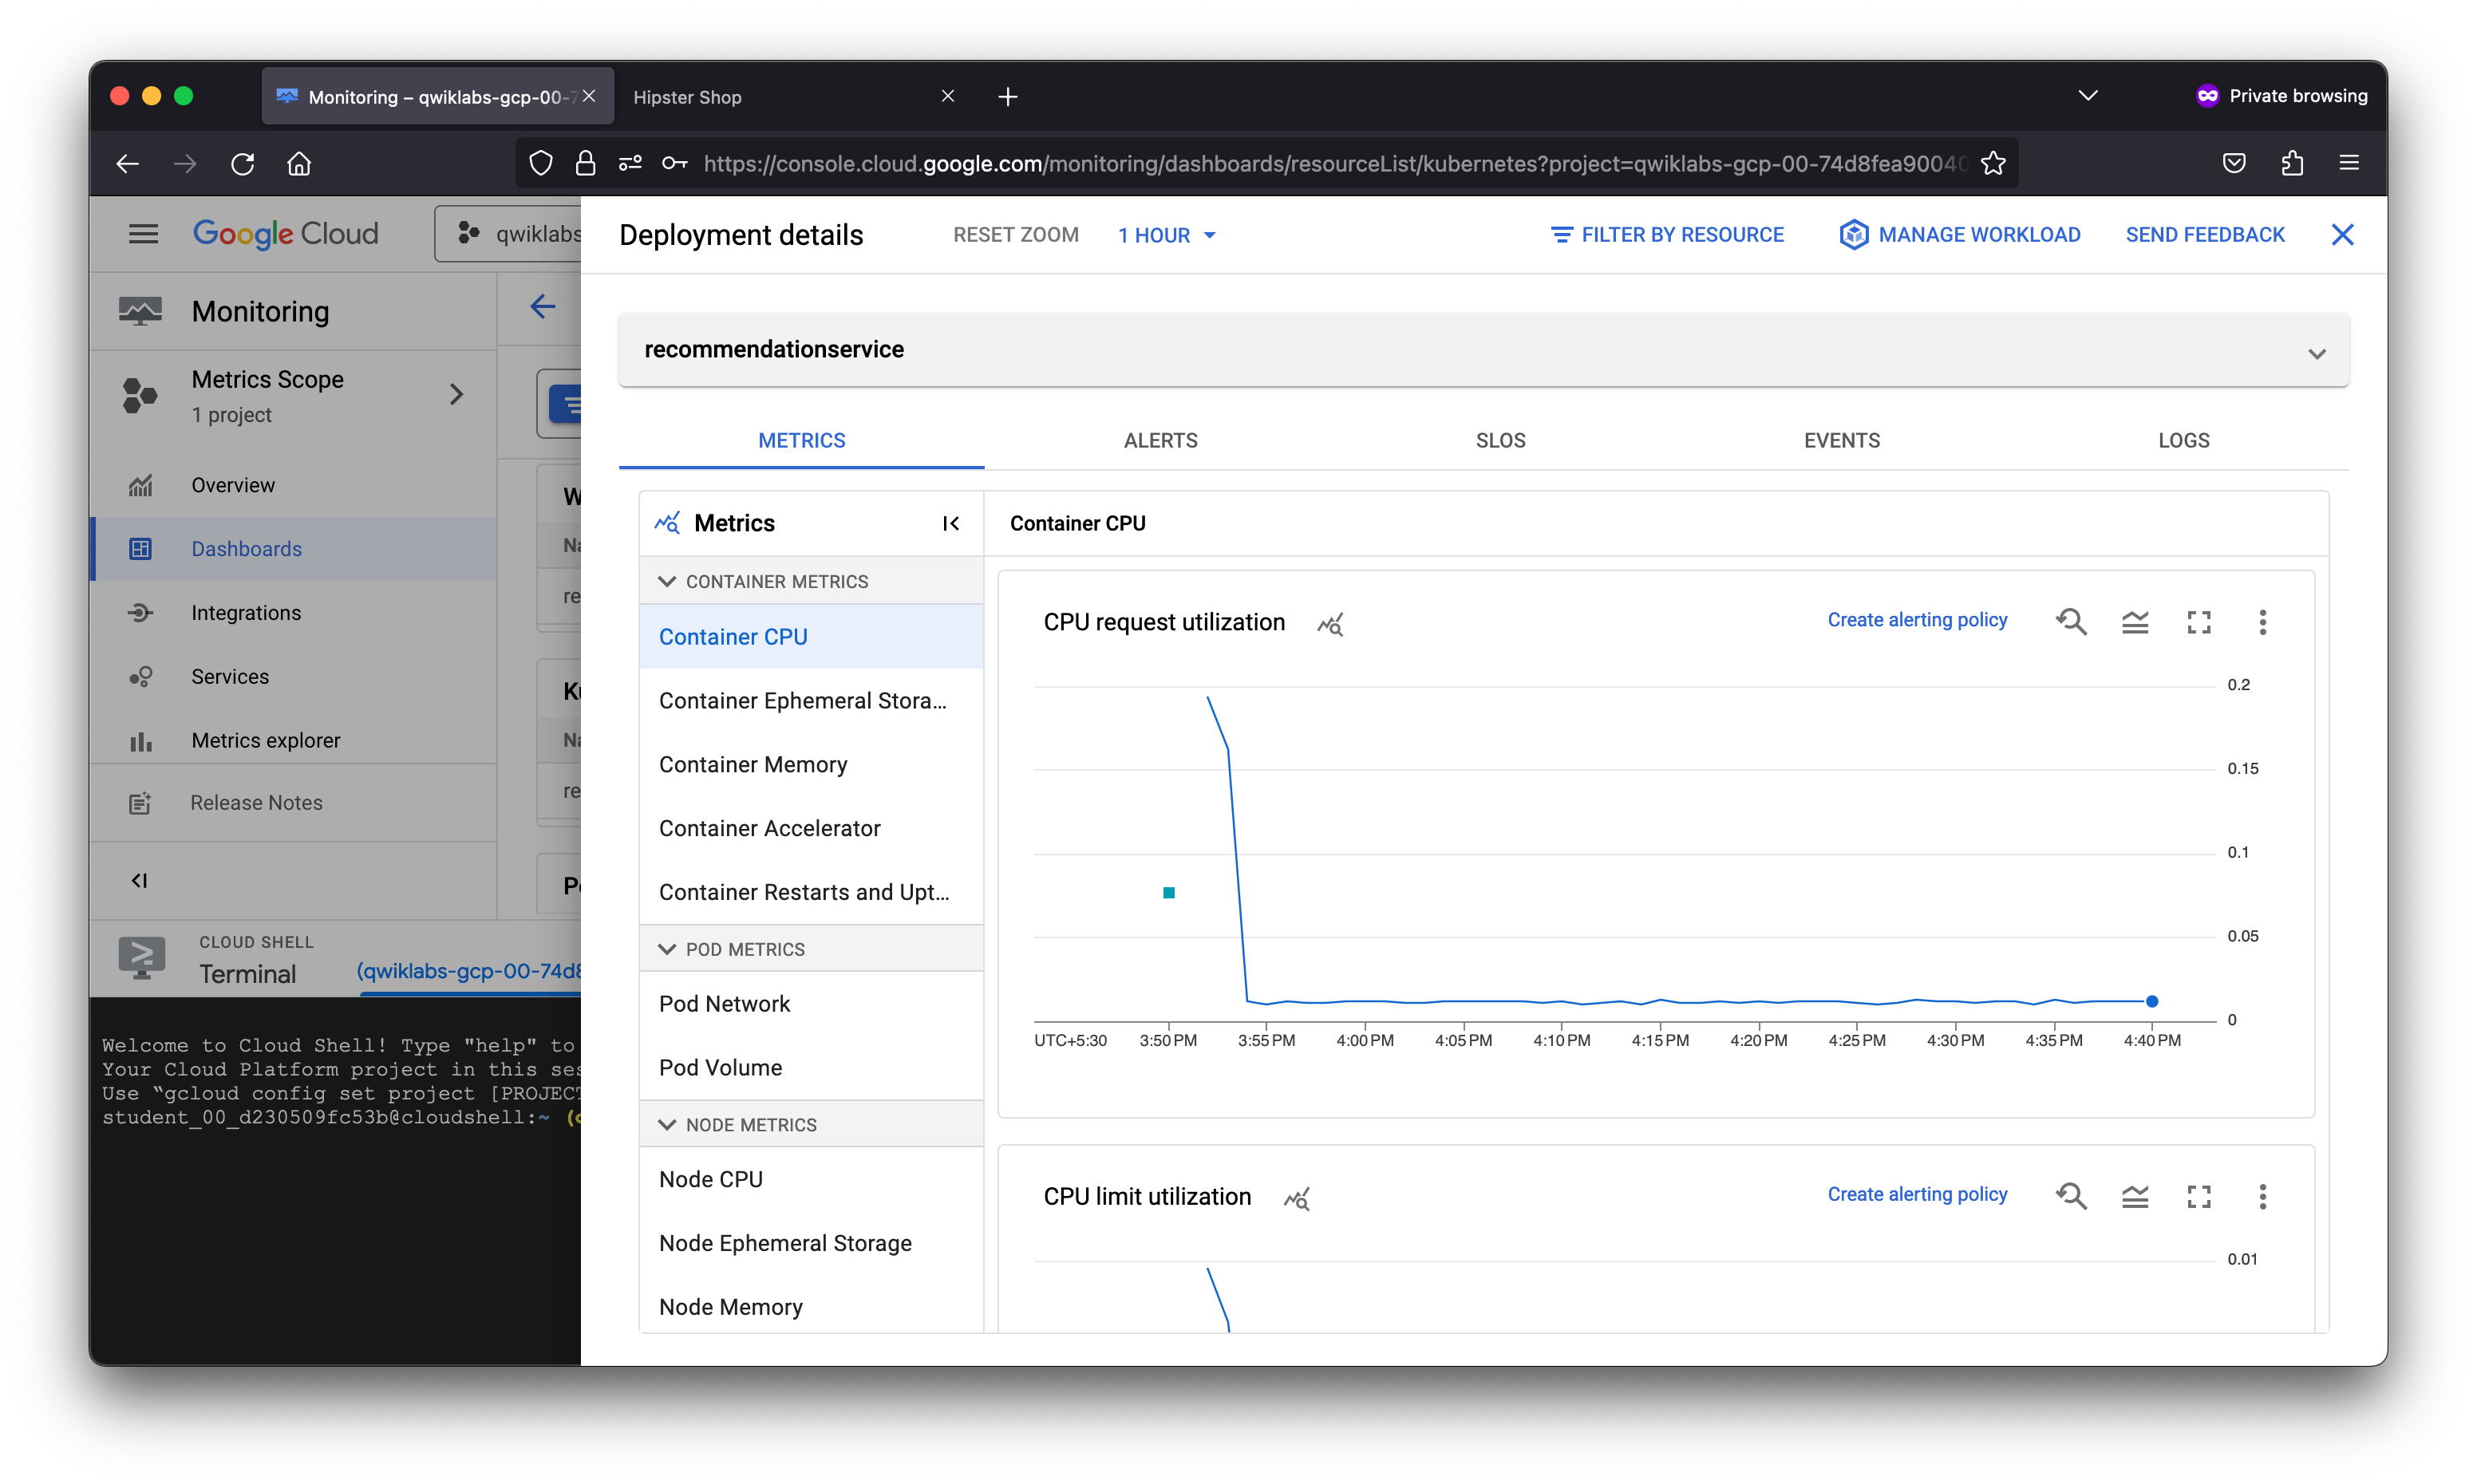
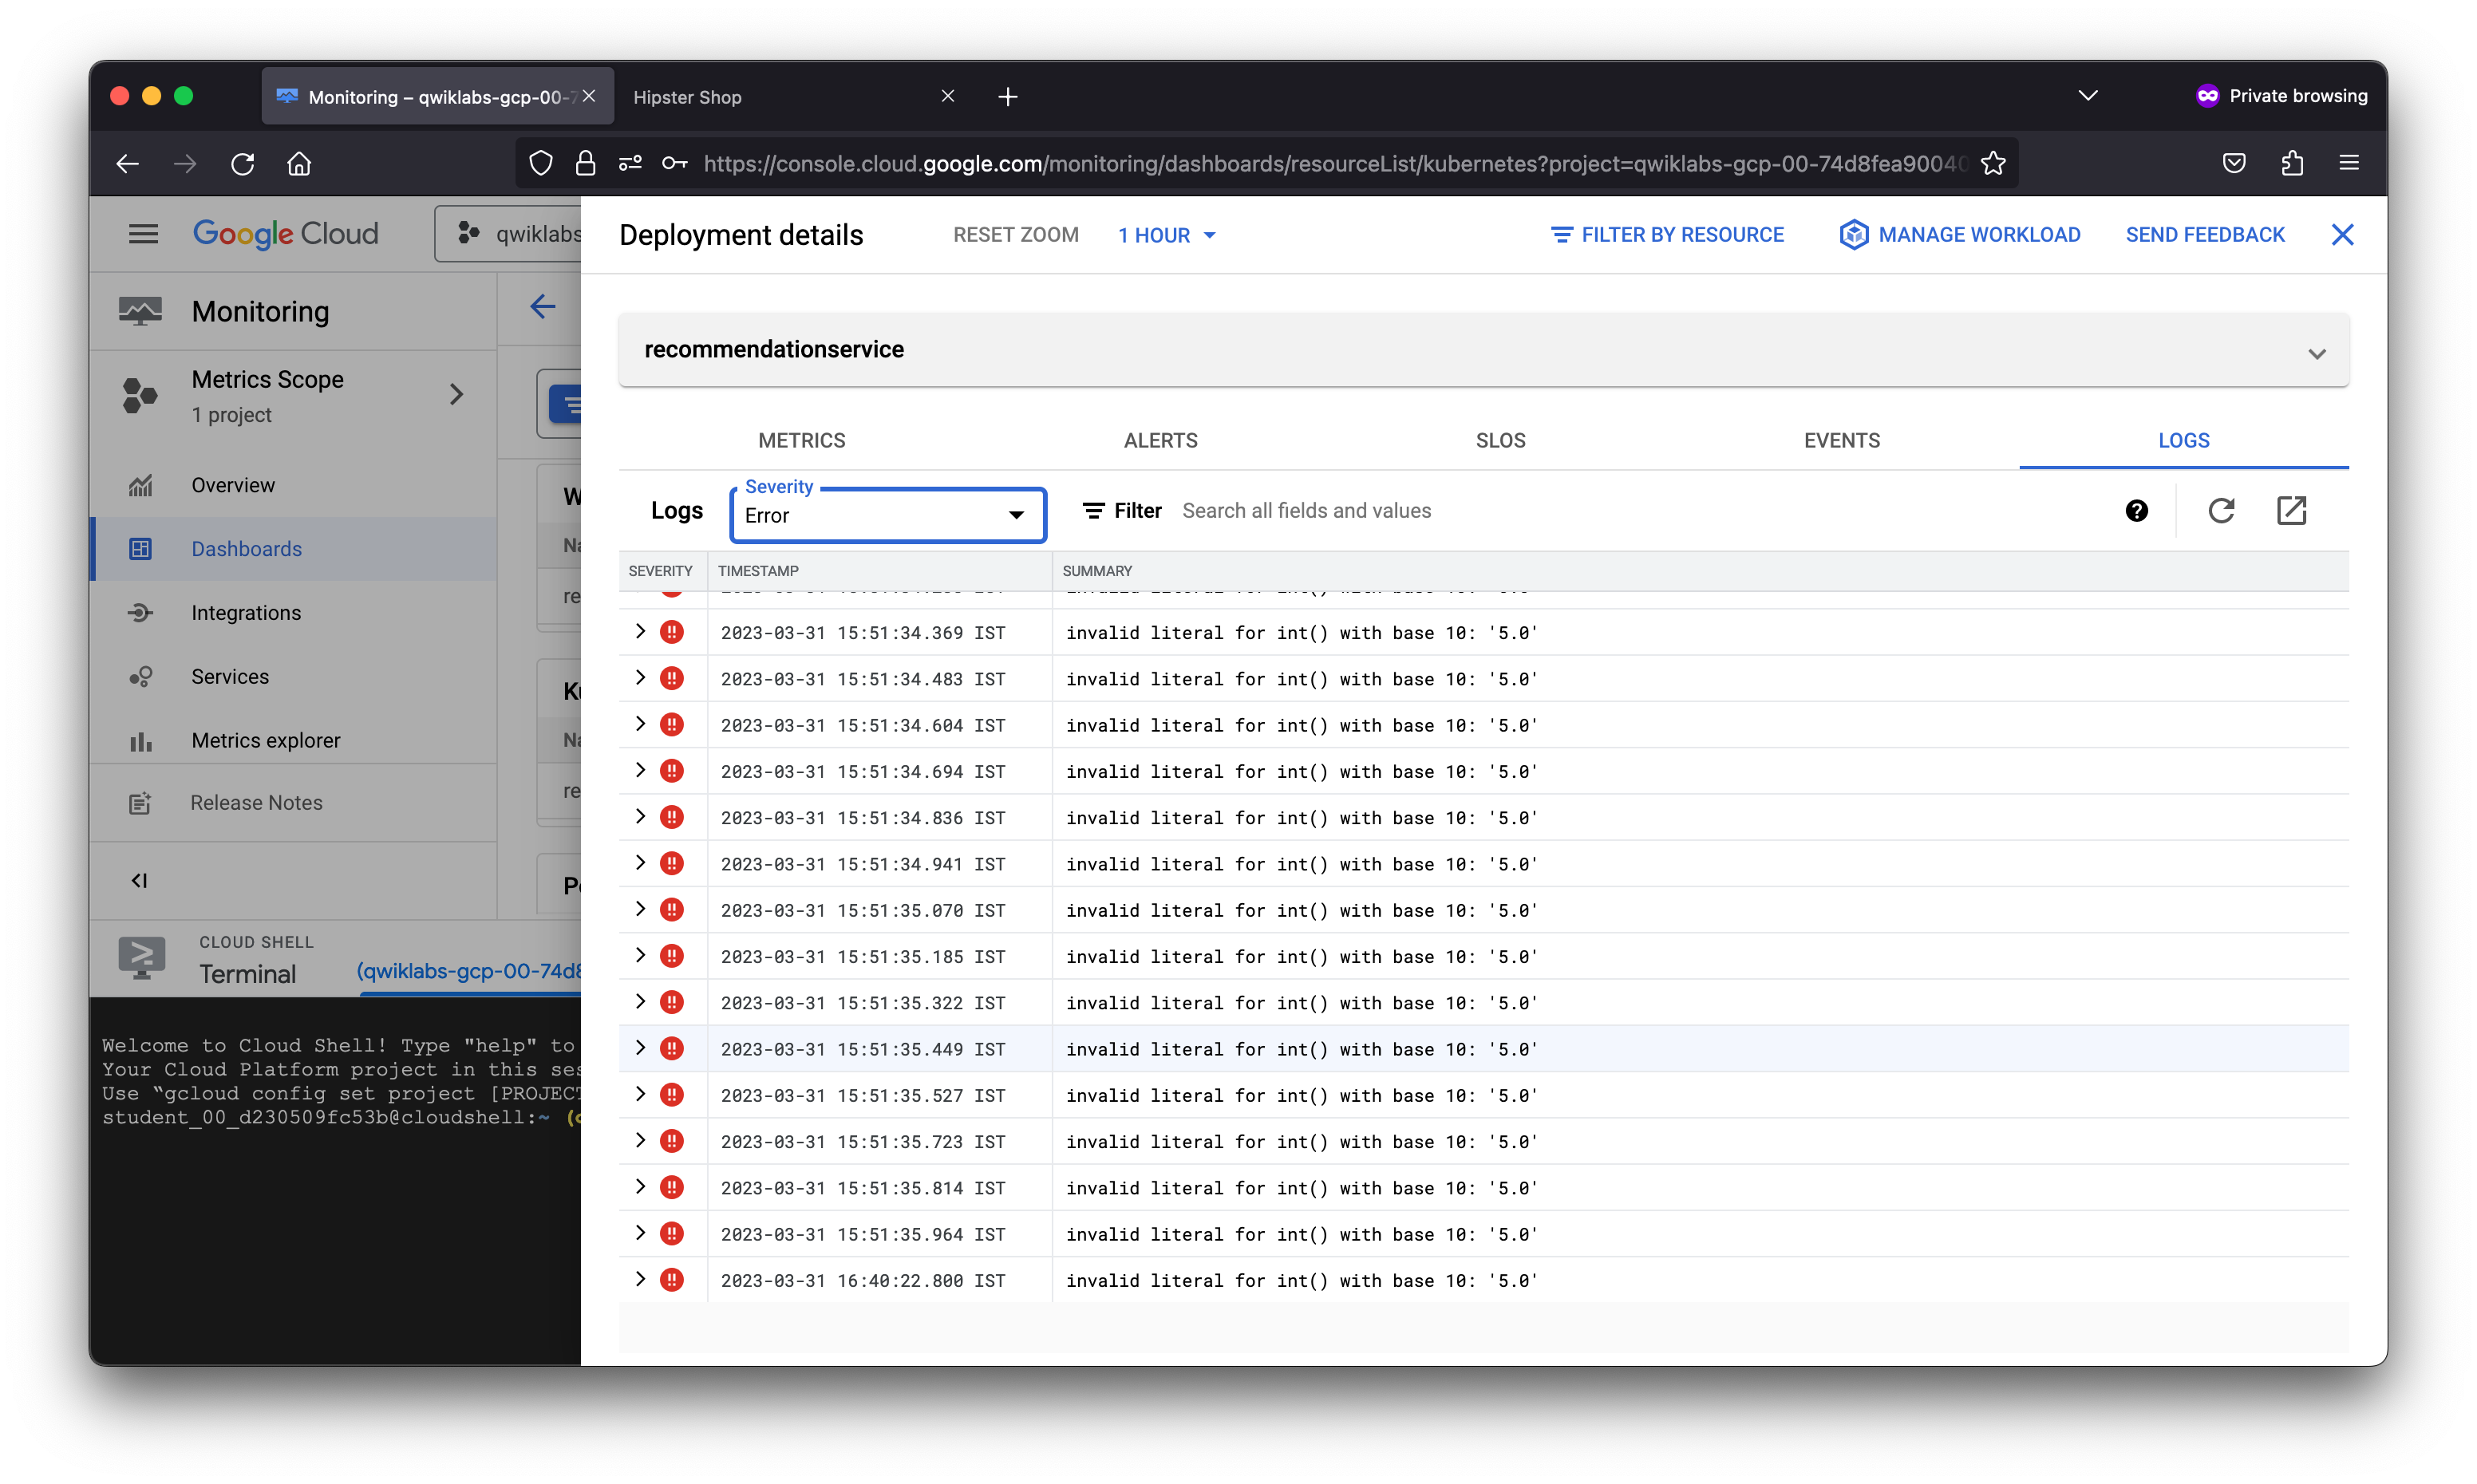
As a member of the Site Reliability Engineering (SRE) team, you are contacted when end users report issues viewing products and adding them to their cart. You will explore the various services deployed to determine the root cause of the issue and set up a Service Level Objective (SLO) to prevent similar incidents from occurring in the future.
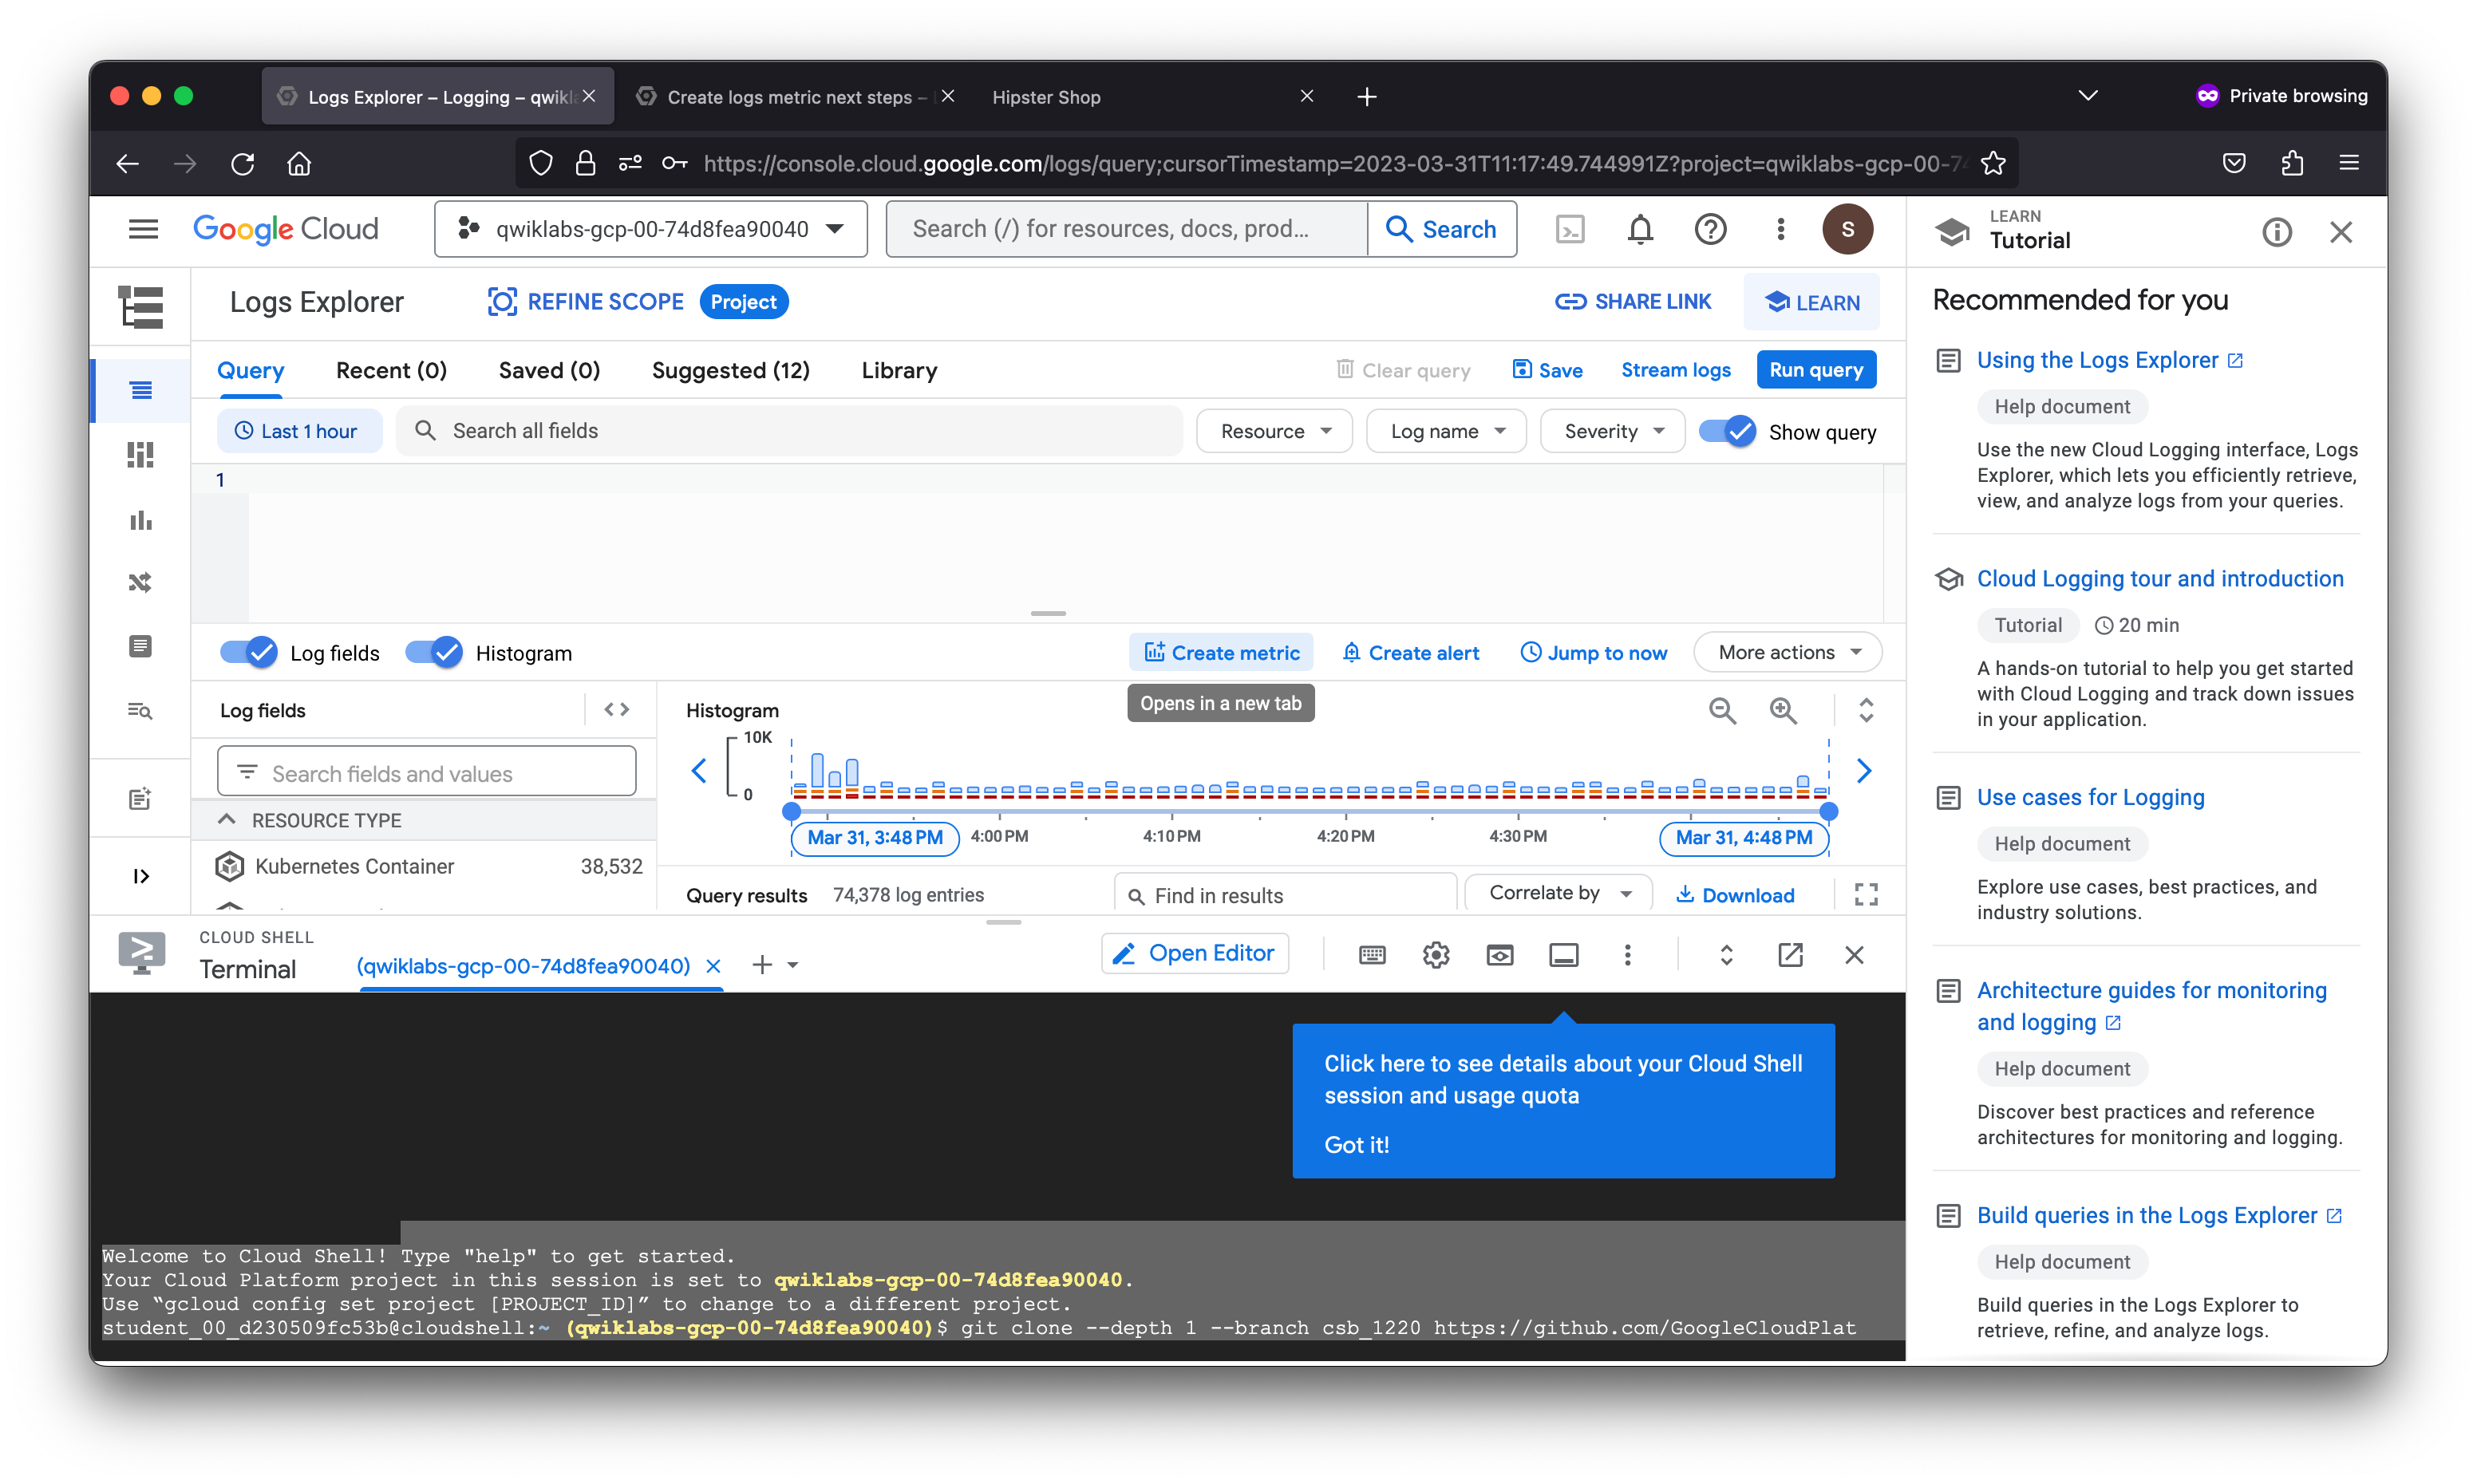
Welcome to Cloud Shell! Type "help" to get started.
Your Cloud Platform project in this session is set to qwiklabs-gcp-00-74d8fea90040.
Use “gcloud config set project [PROJECT_ID]” to change to a different project.
student_00_d230509fc53b@cloudshell:~ (qwiklabs-gcp-00-74d8fea90040)$ git clone --depth 1 --branch csb_1220 https://github.com/GoogleCloudPlatform/cloud-ops-sandbox.git
Cloning into 'cloud-ops-sandbox'...
remote: Enumerating objects: 642, done.
remote: Counting objects: 100% (642/642), done.
remote: Compressing objects: 100% (511/511), done.
remote: Total 642 (delta 141), reused 364 (delta 63), pack-reused 0
Receiving objects: 100% (642/642), 17.85 MiB | 17.66 MiB/s, done.
Resolving deltas: 100% (141/141), done.
student_00_d230509fc53b@cloudshell:~ (qwiklabs-gcp-00-74d8fea90040)$ cd cloud-ops-sandbox/sre-recipes/
student_00_d230509fc53b@cloudshell:~/cloud-ops-sandbox/sre-recipes (qwiklabs-gcp-00-74d8fea90040)$ gcloud container clusters get-credentials cloud-ops-sandbox --zone us-central1-b --project qwiklabs-gcp-00-74d8fea90040
Fetching cluster endpoint and auth data.
kubeconfig entry generated for cloud-ops-sandbox.
student_00_d230509fc53b@cloudshell:~/cloud-ops-sandbox/sre-recipes (qwiklabs-gcp-00-74d8fea90040)$ ./sandboxctl sre-recipes restore "recipe3"
Restoring service back to normal...
Done. Restored broken service to working state.
student_00_d230509fc53b@cloudshell:~/cloud-ops-sandbox/sre-recipes (qwiklabs-gcp-00-74d8fea90040)$
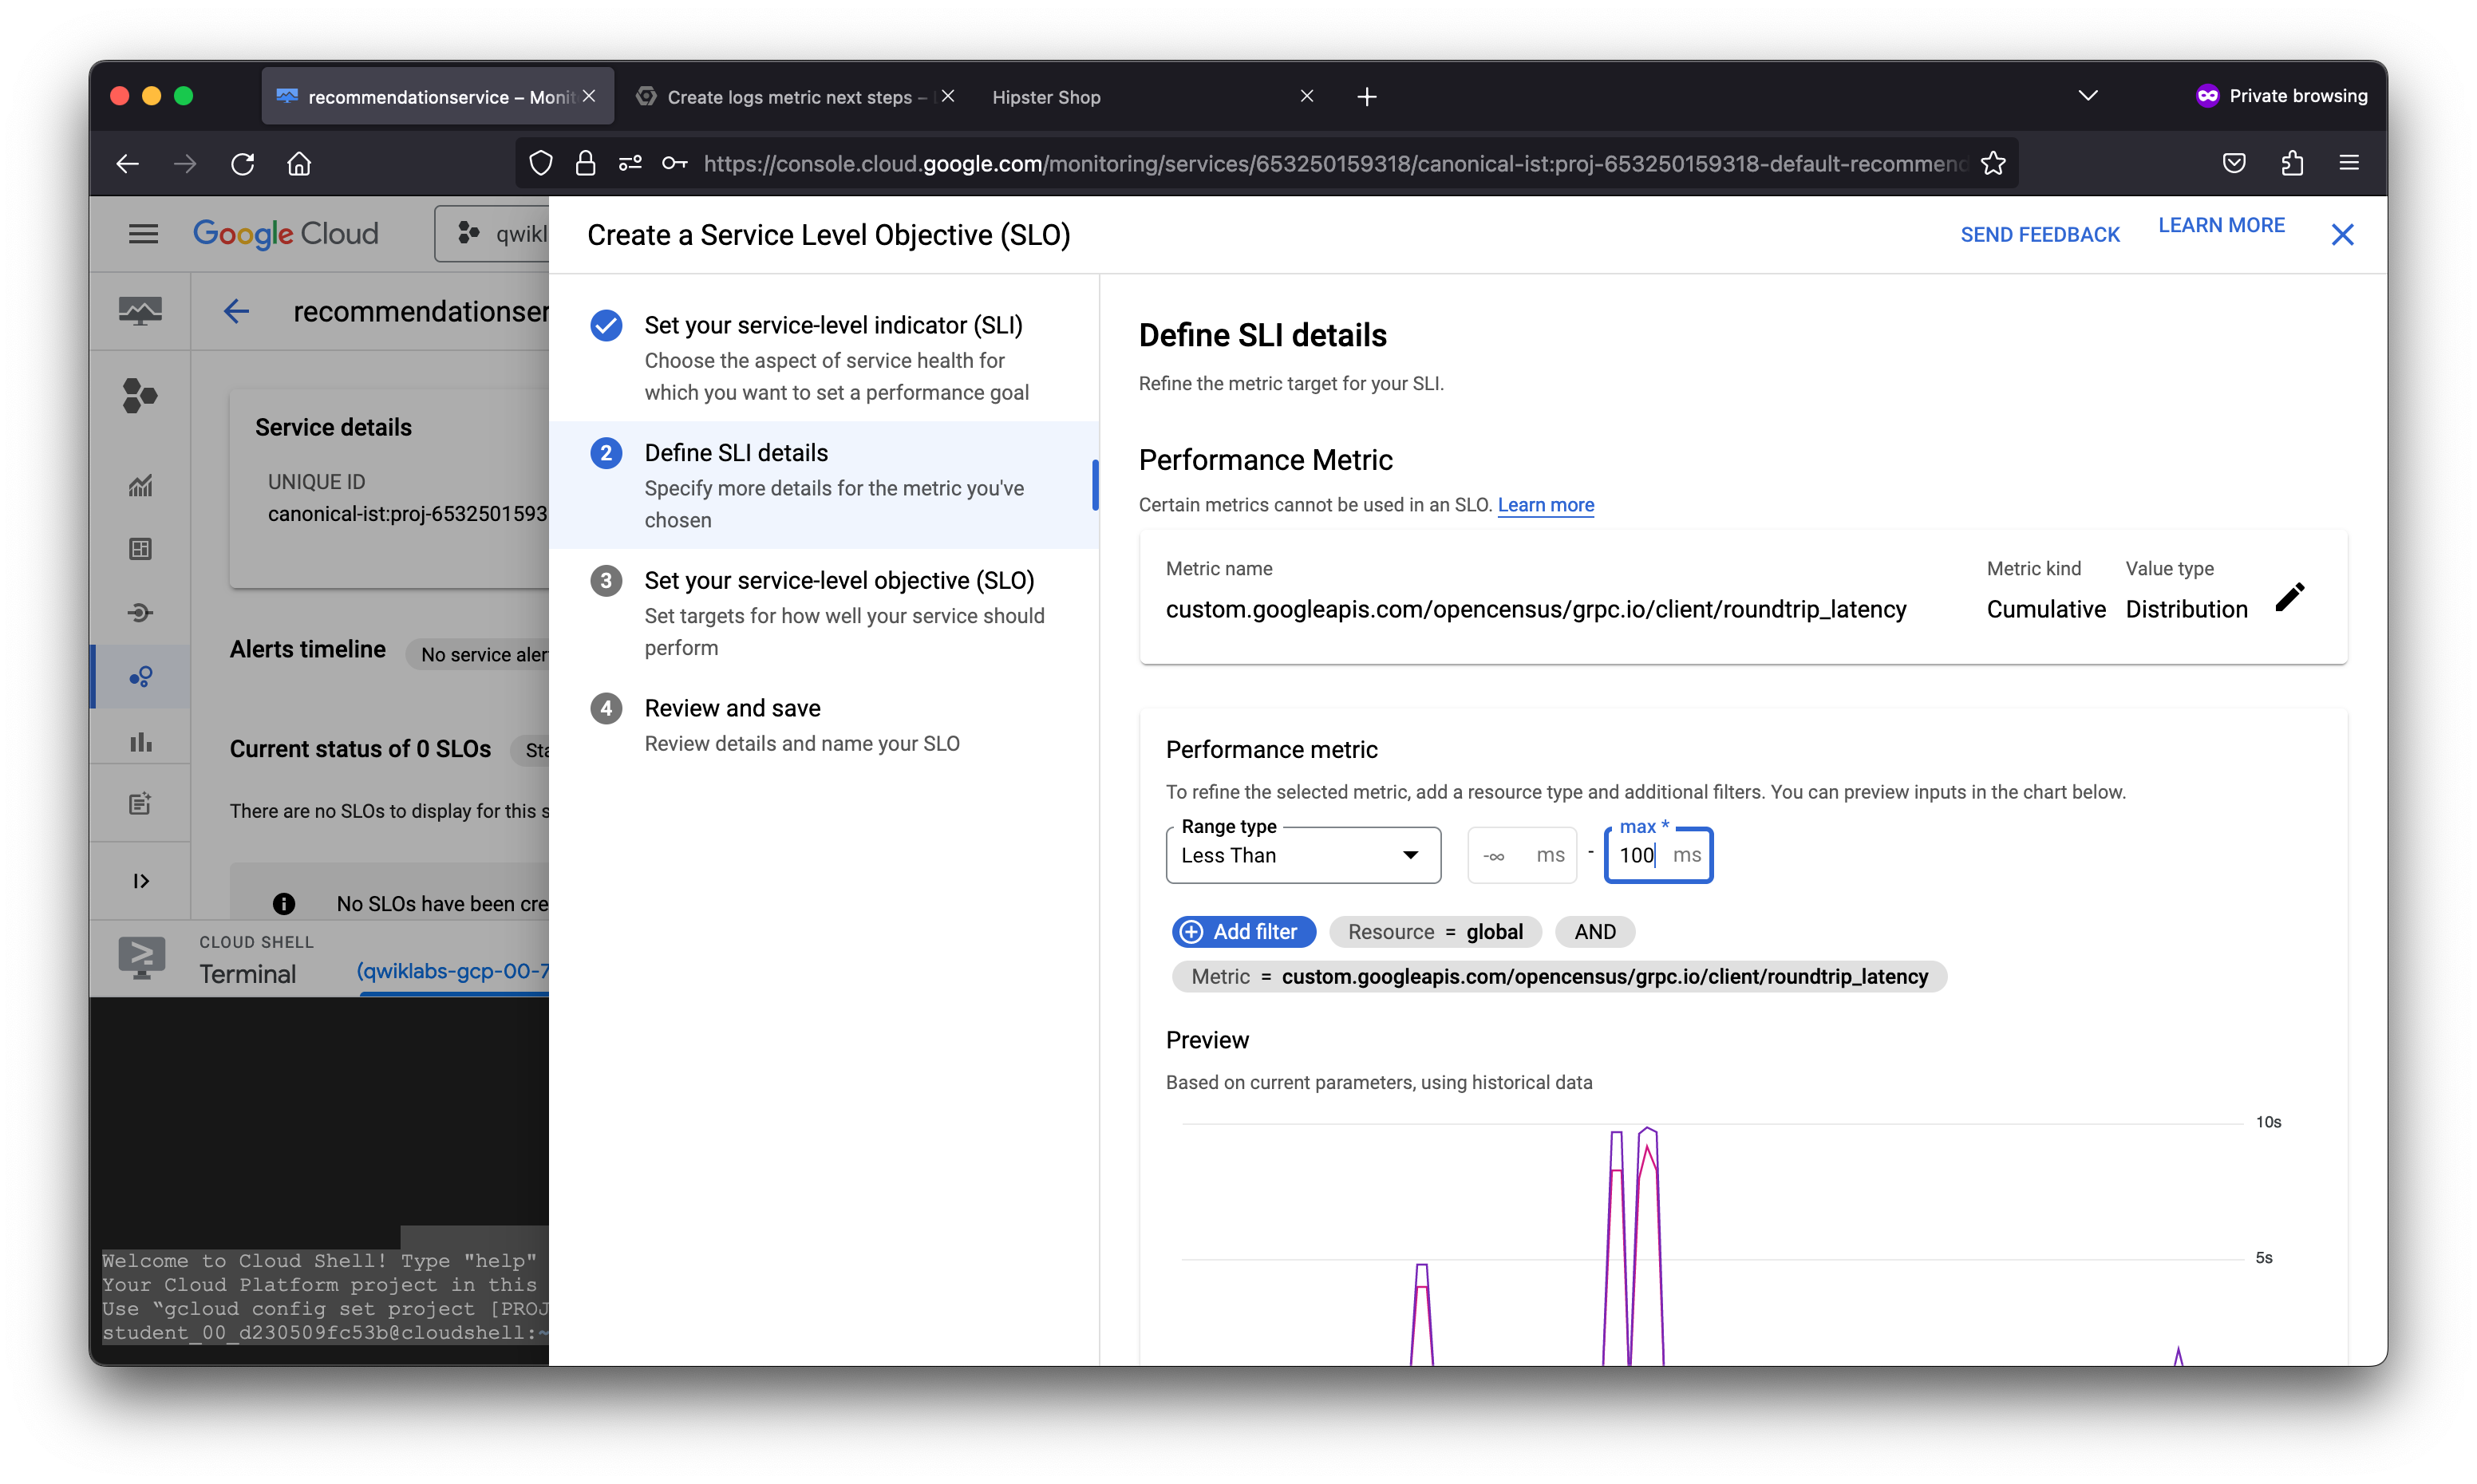
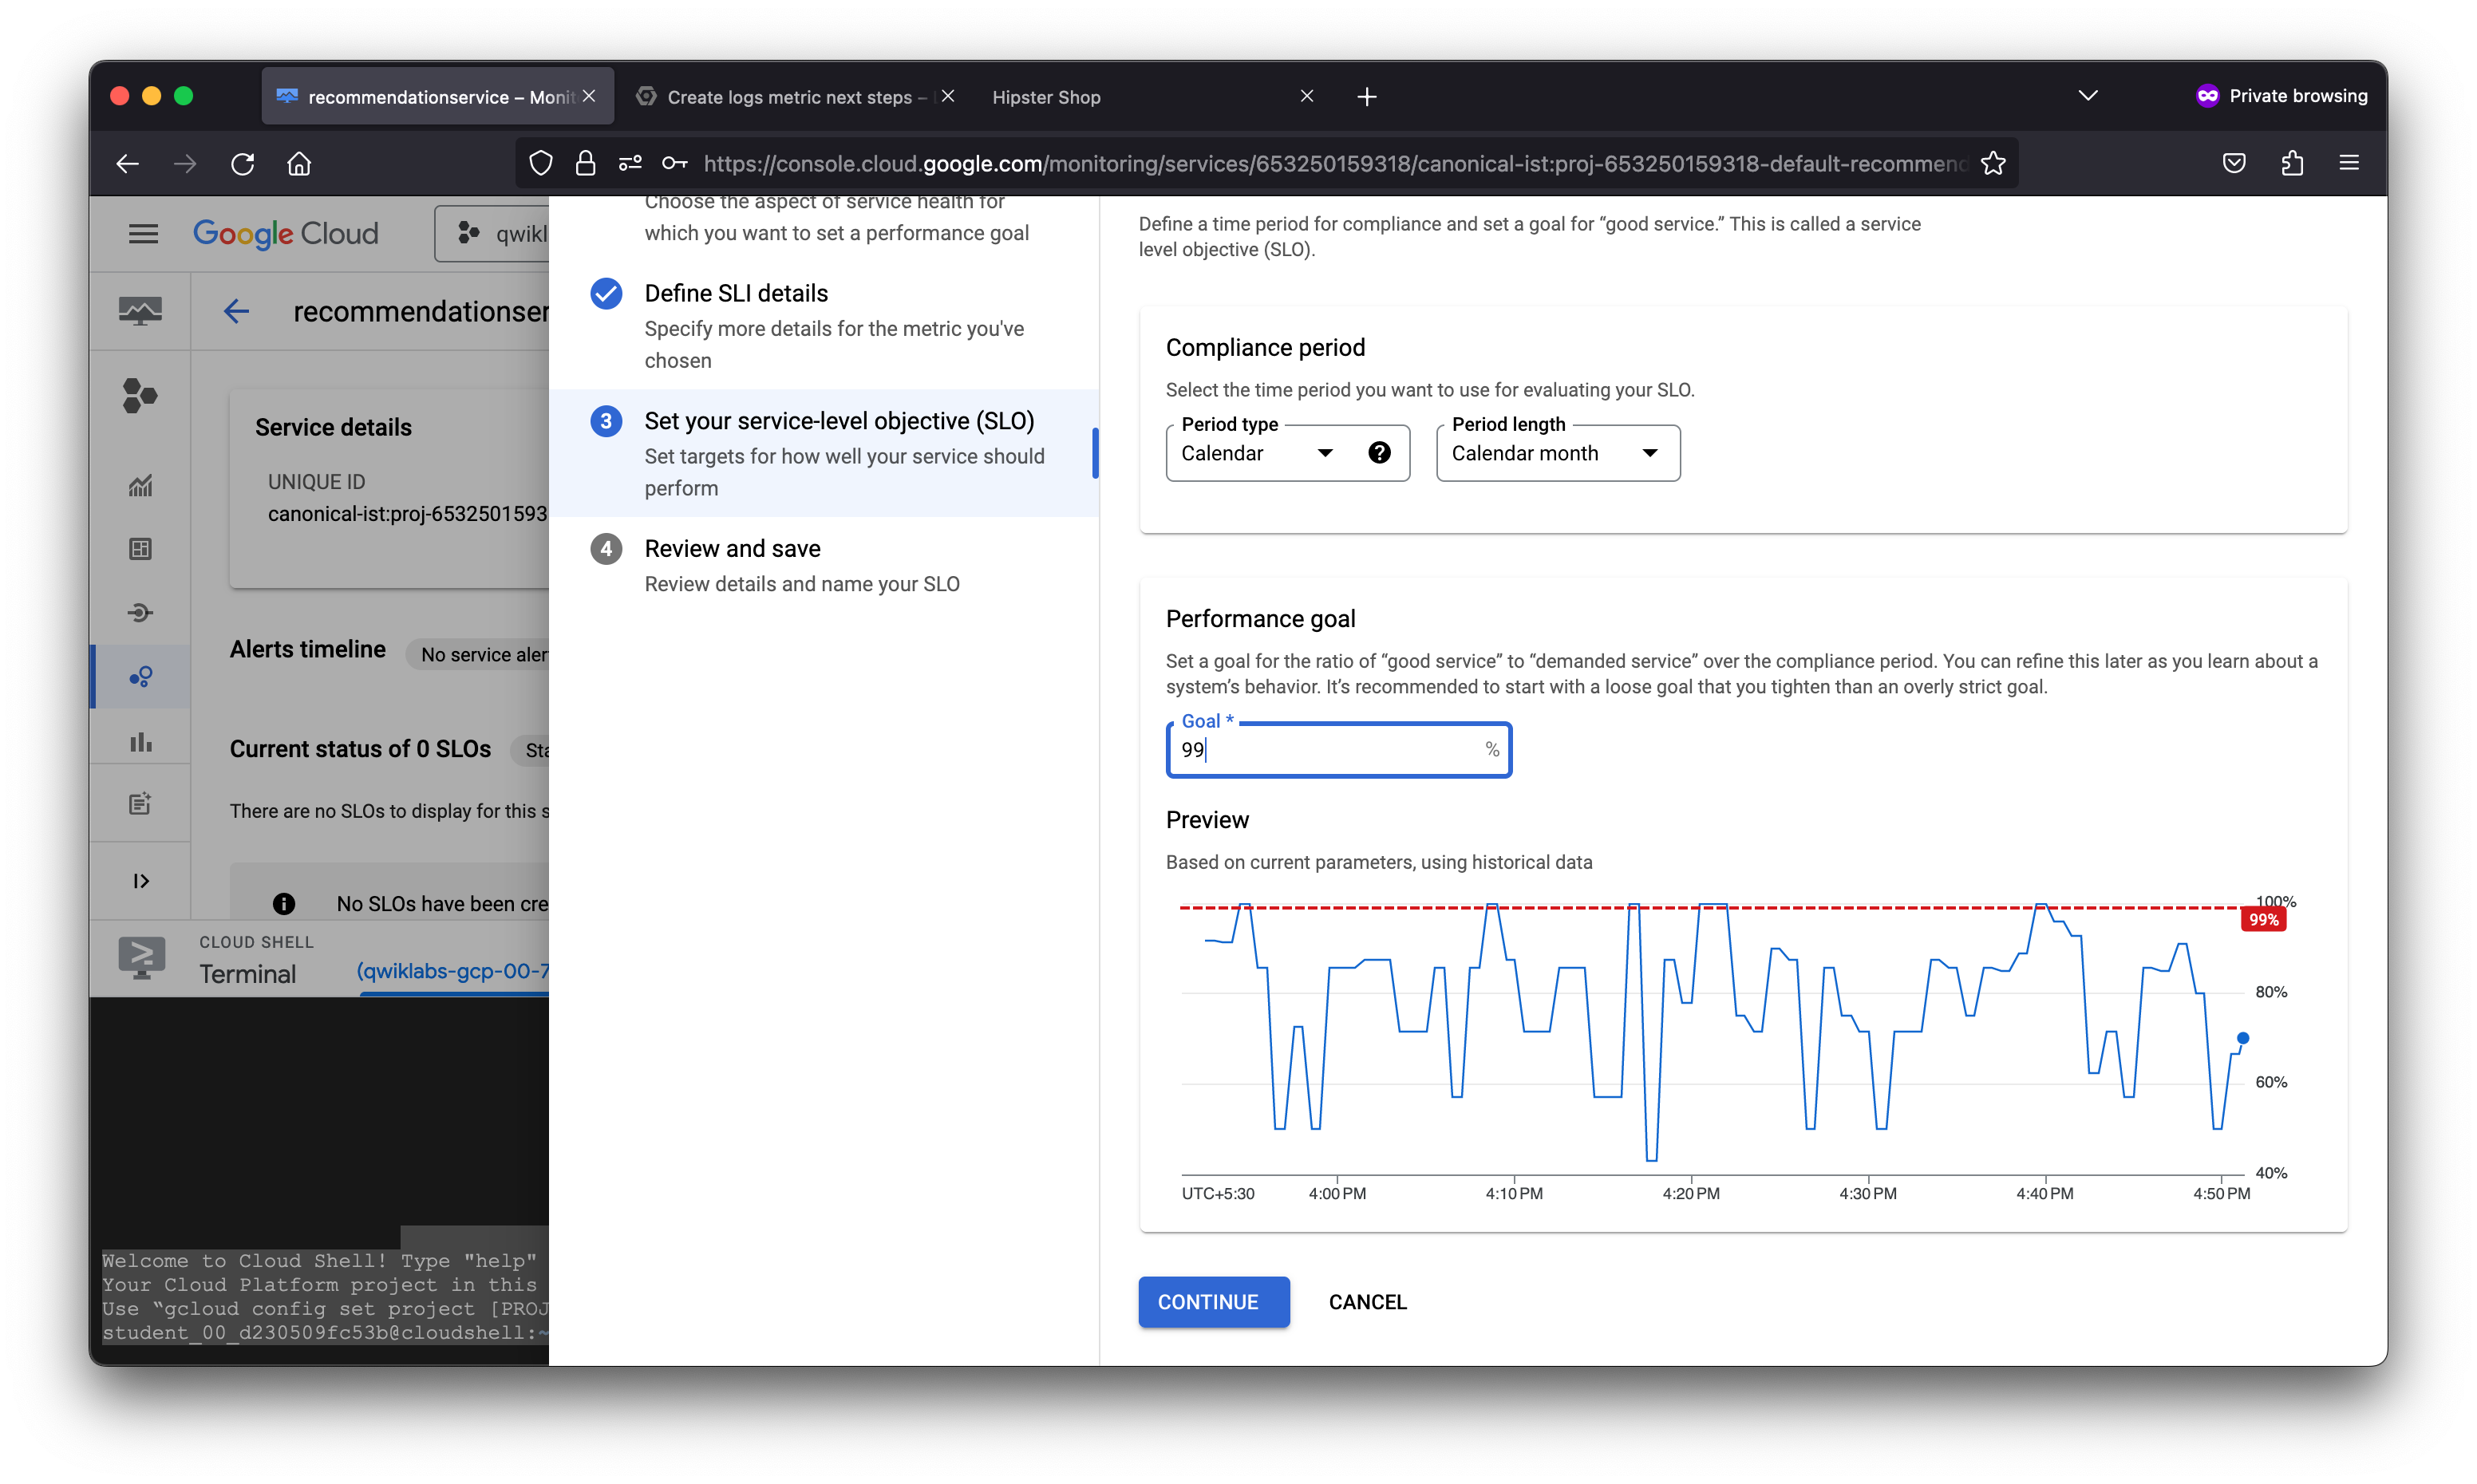
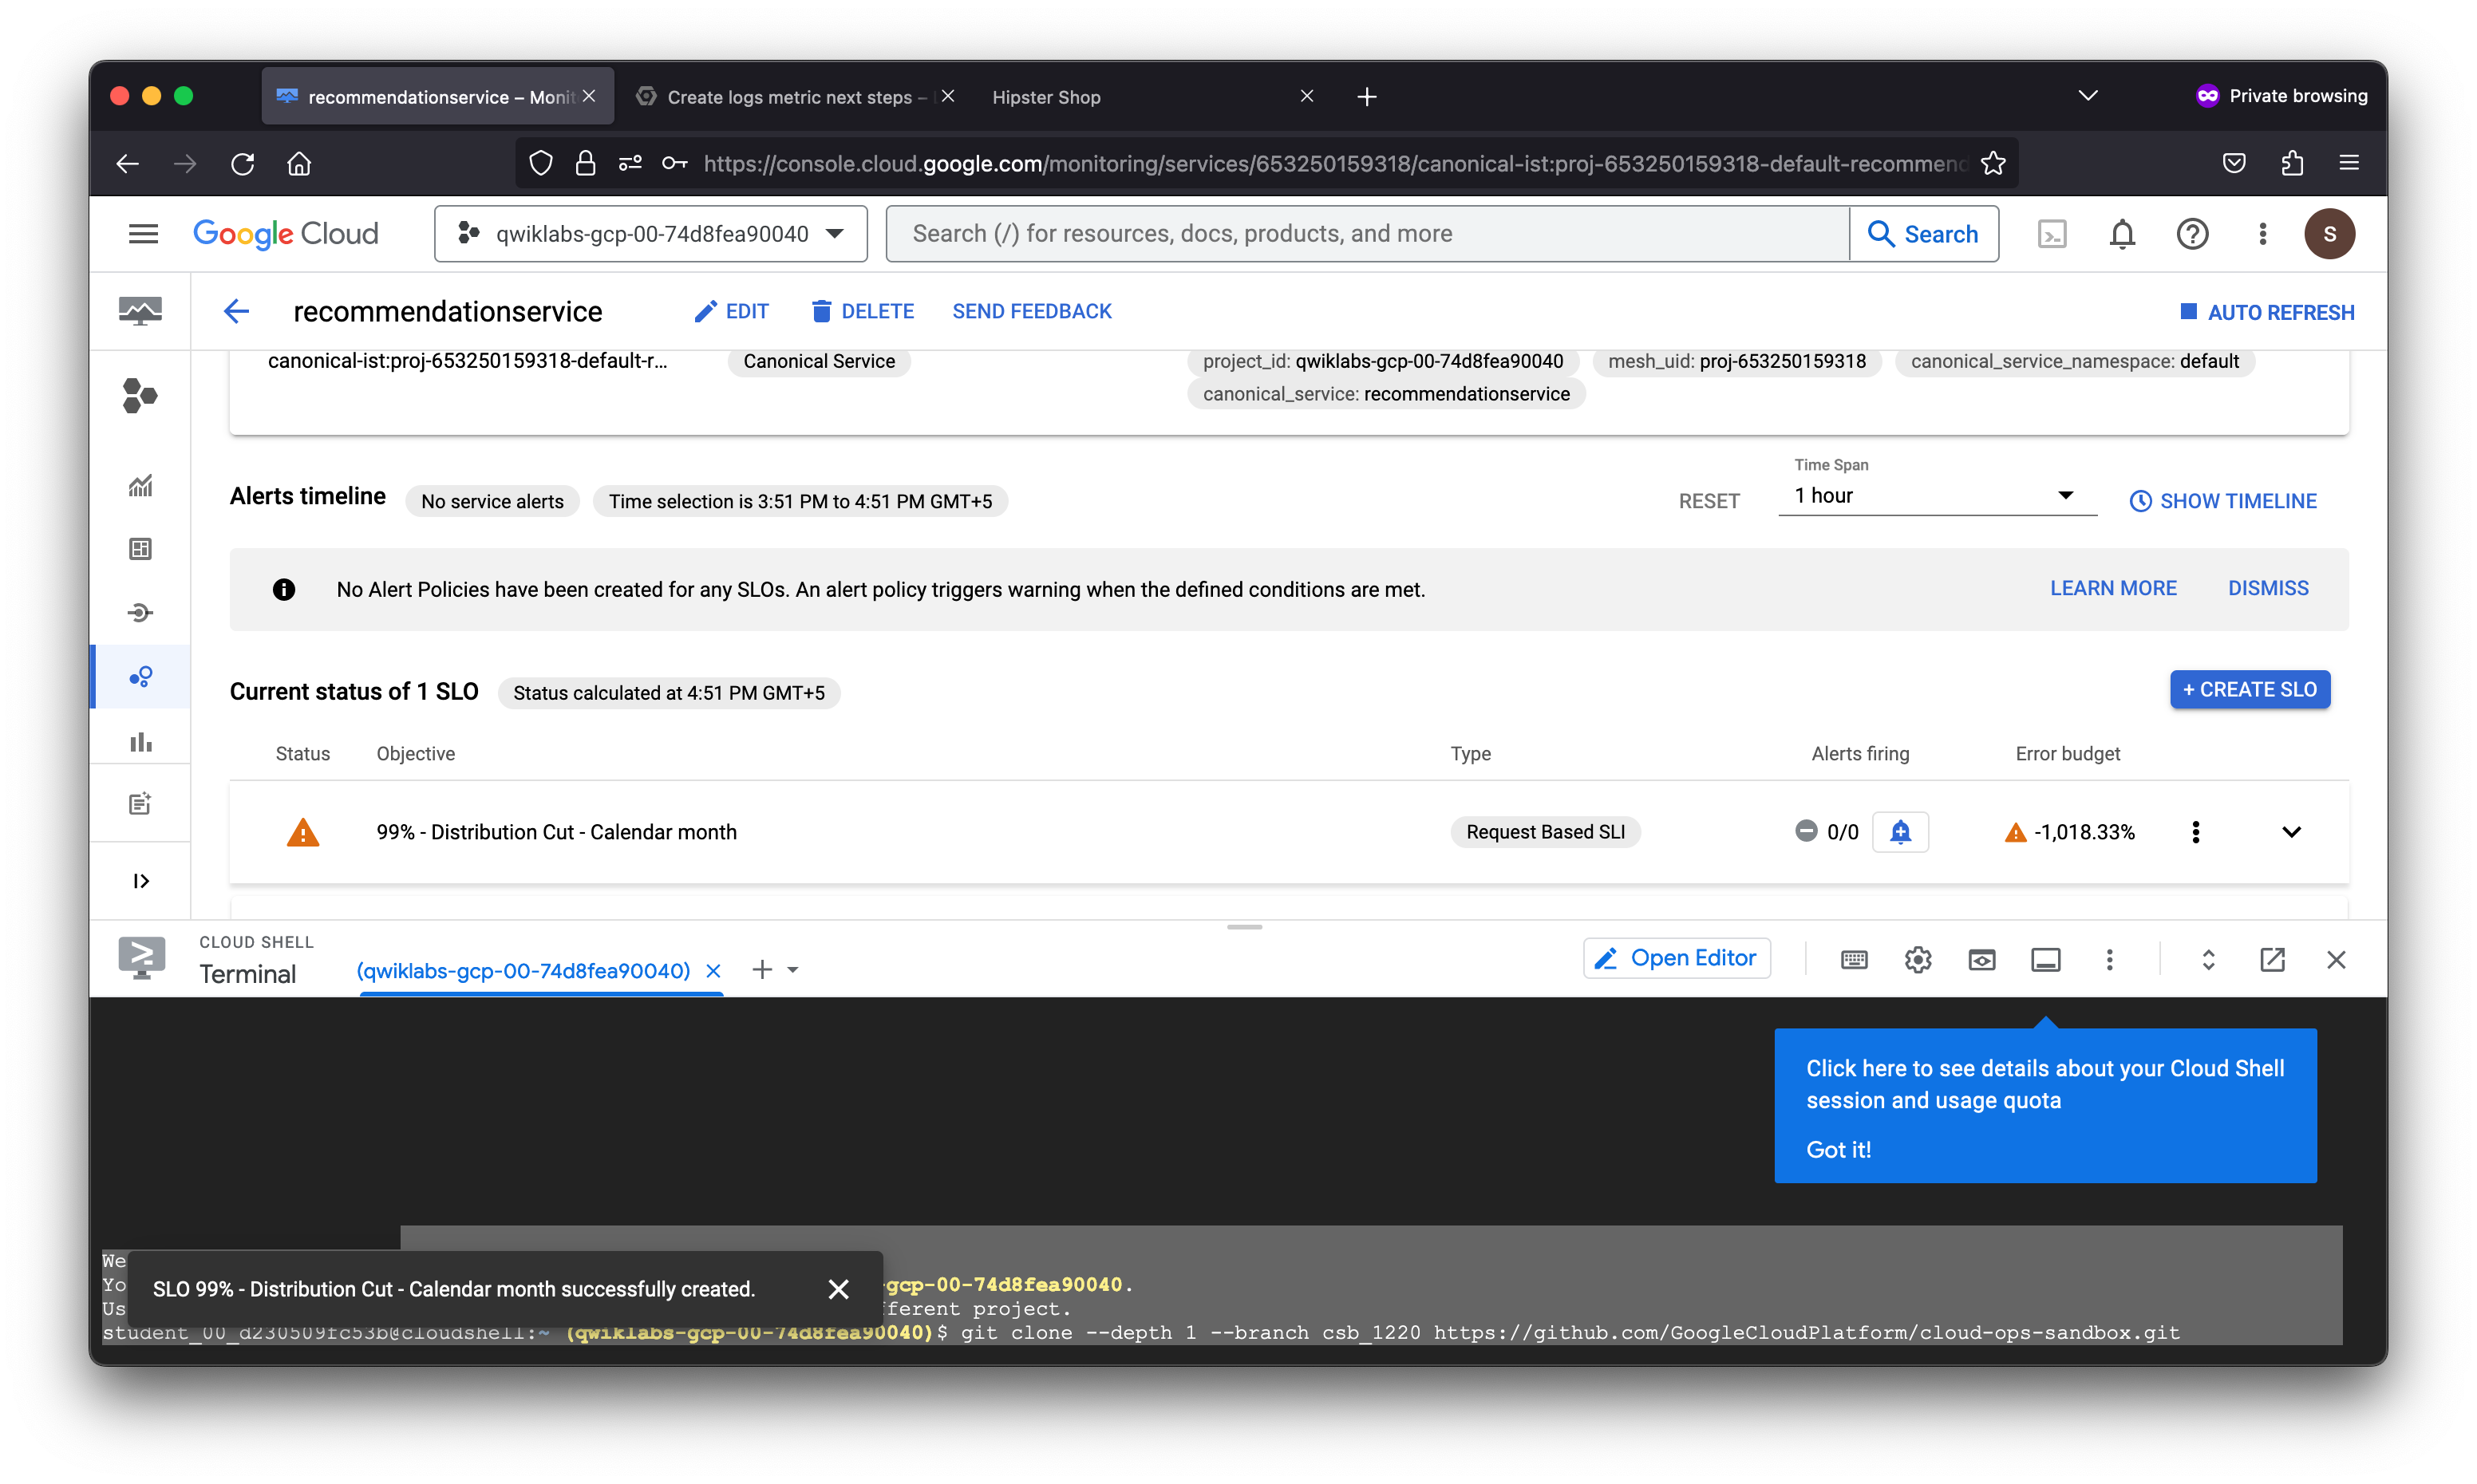
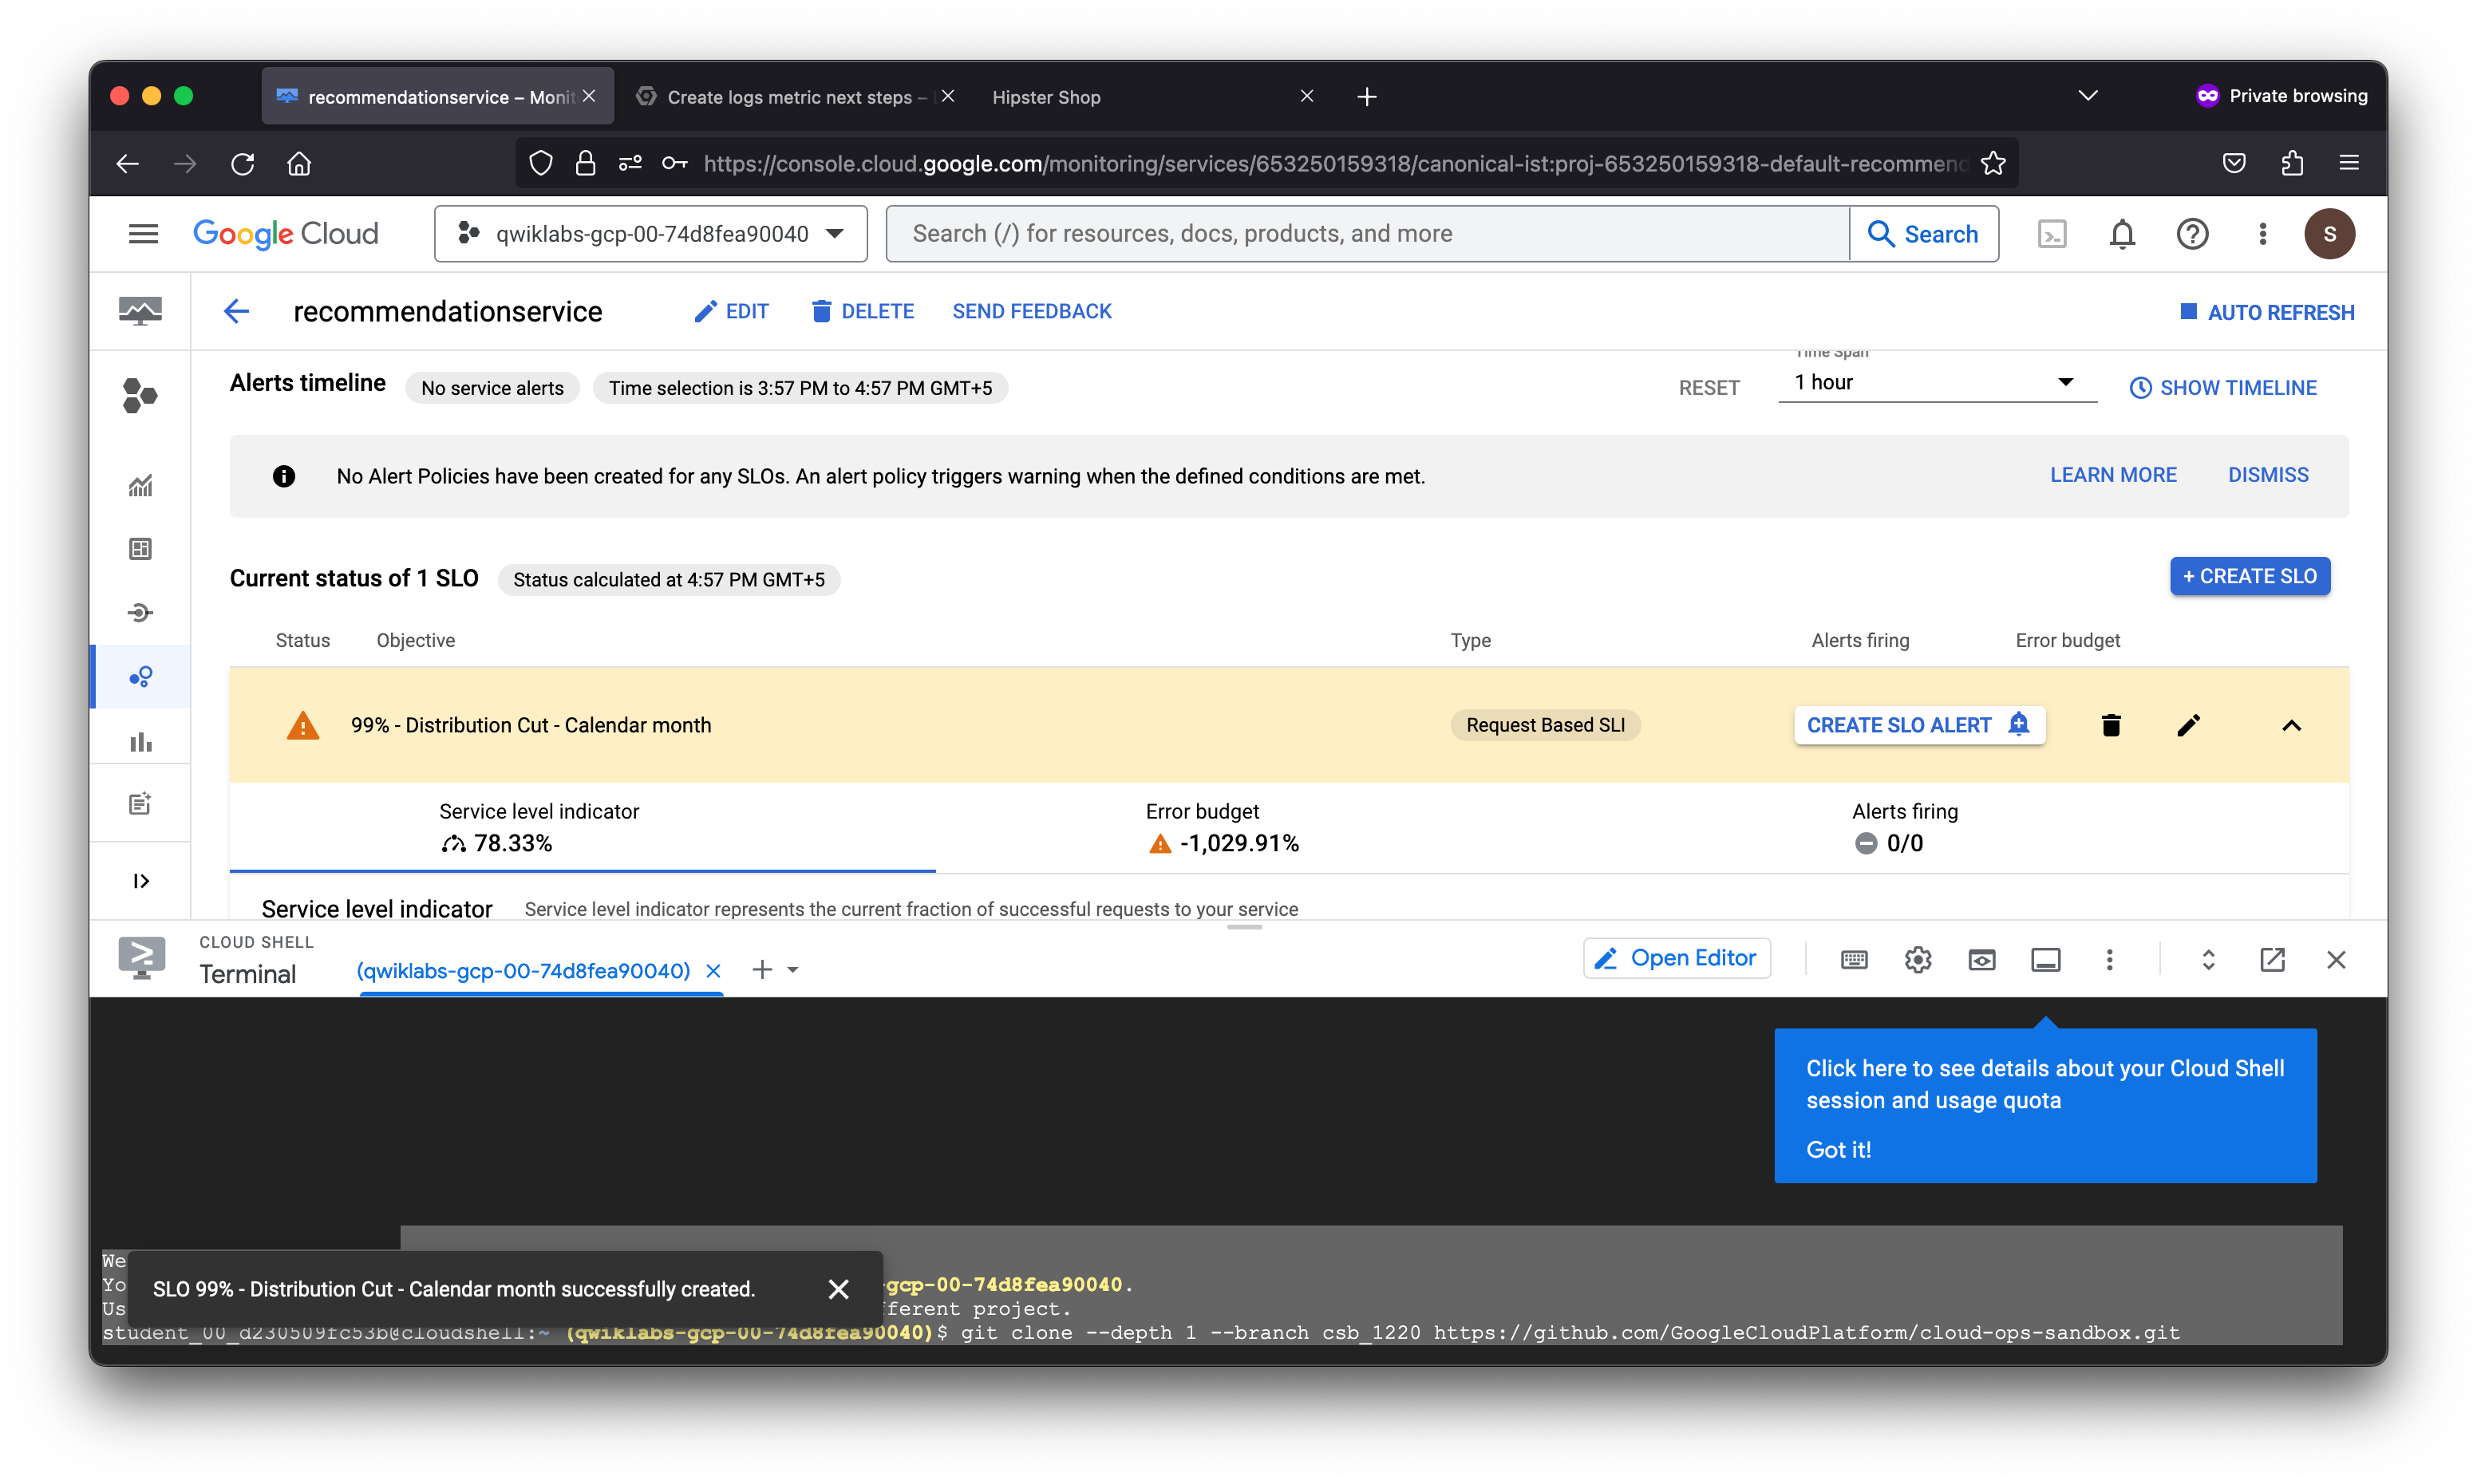
After creating a logs-based metric which closely describes the user experience, the SRE team will use it to measure user happiness, these metrics are our SLIs and will be used to define a Service Level Objective (SLO) on the recommendationservice. You use an SLO to specify service-level objectives for performance metrics. An SLO is a measurable goal for performance over a period of time.
{
  "displayName": "99% - Distribution Cut - Calendar month",
  "goal": 0.99,
  "calendarPeriod": "MONTH",
  "serviceLevelIndicator": {
    "requestBased": {
      "distributionCut": {
        "distributionFilter": "metric.type=\"custom.googleapis.com/opencensus/grpc.io/client/roundtrip_latency\" resource.type=\"global\"",
        "range": {
          "min": -9007199254740991,
          "max": 100
        }
      }
    }
  }
}
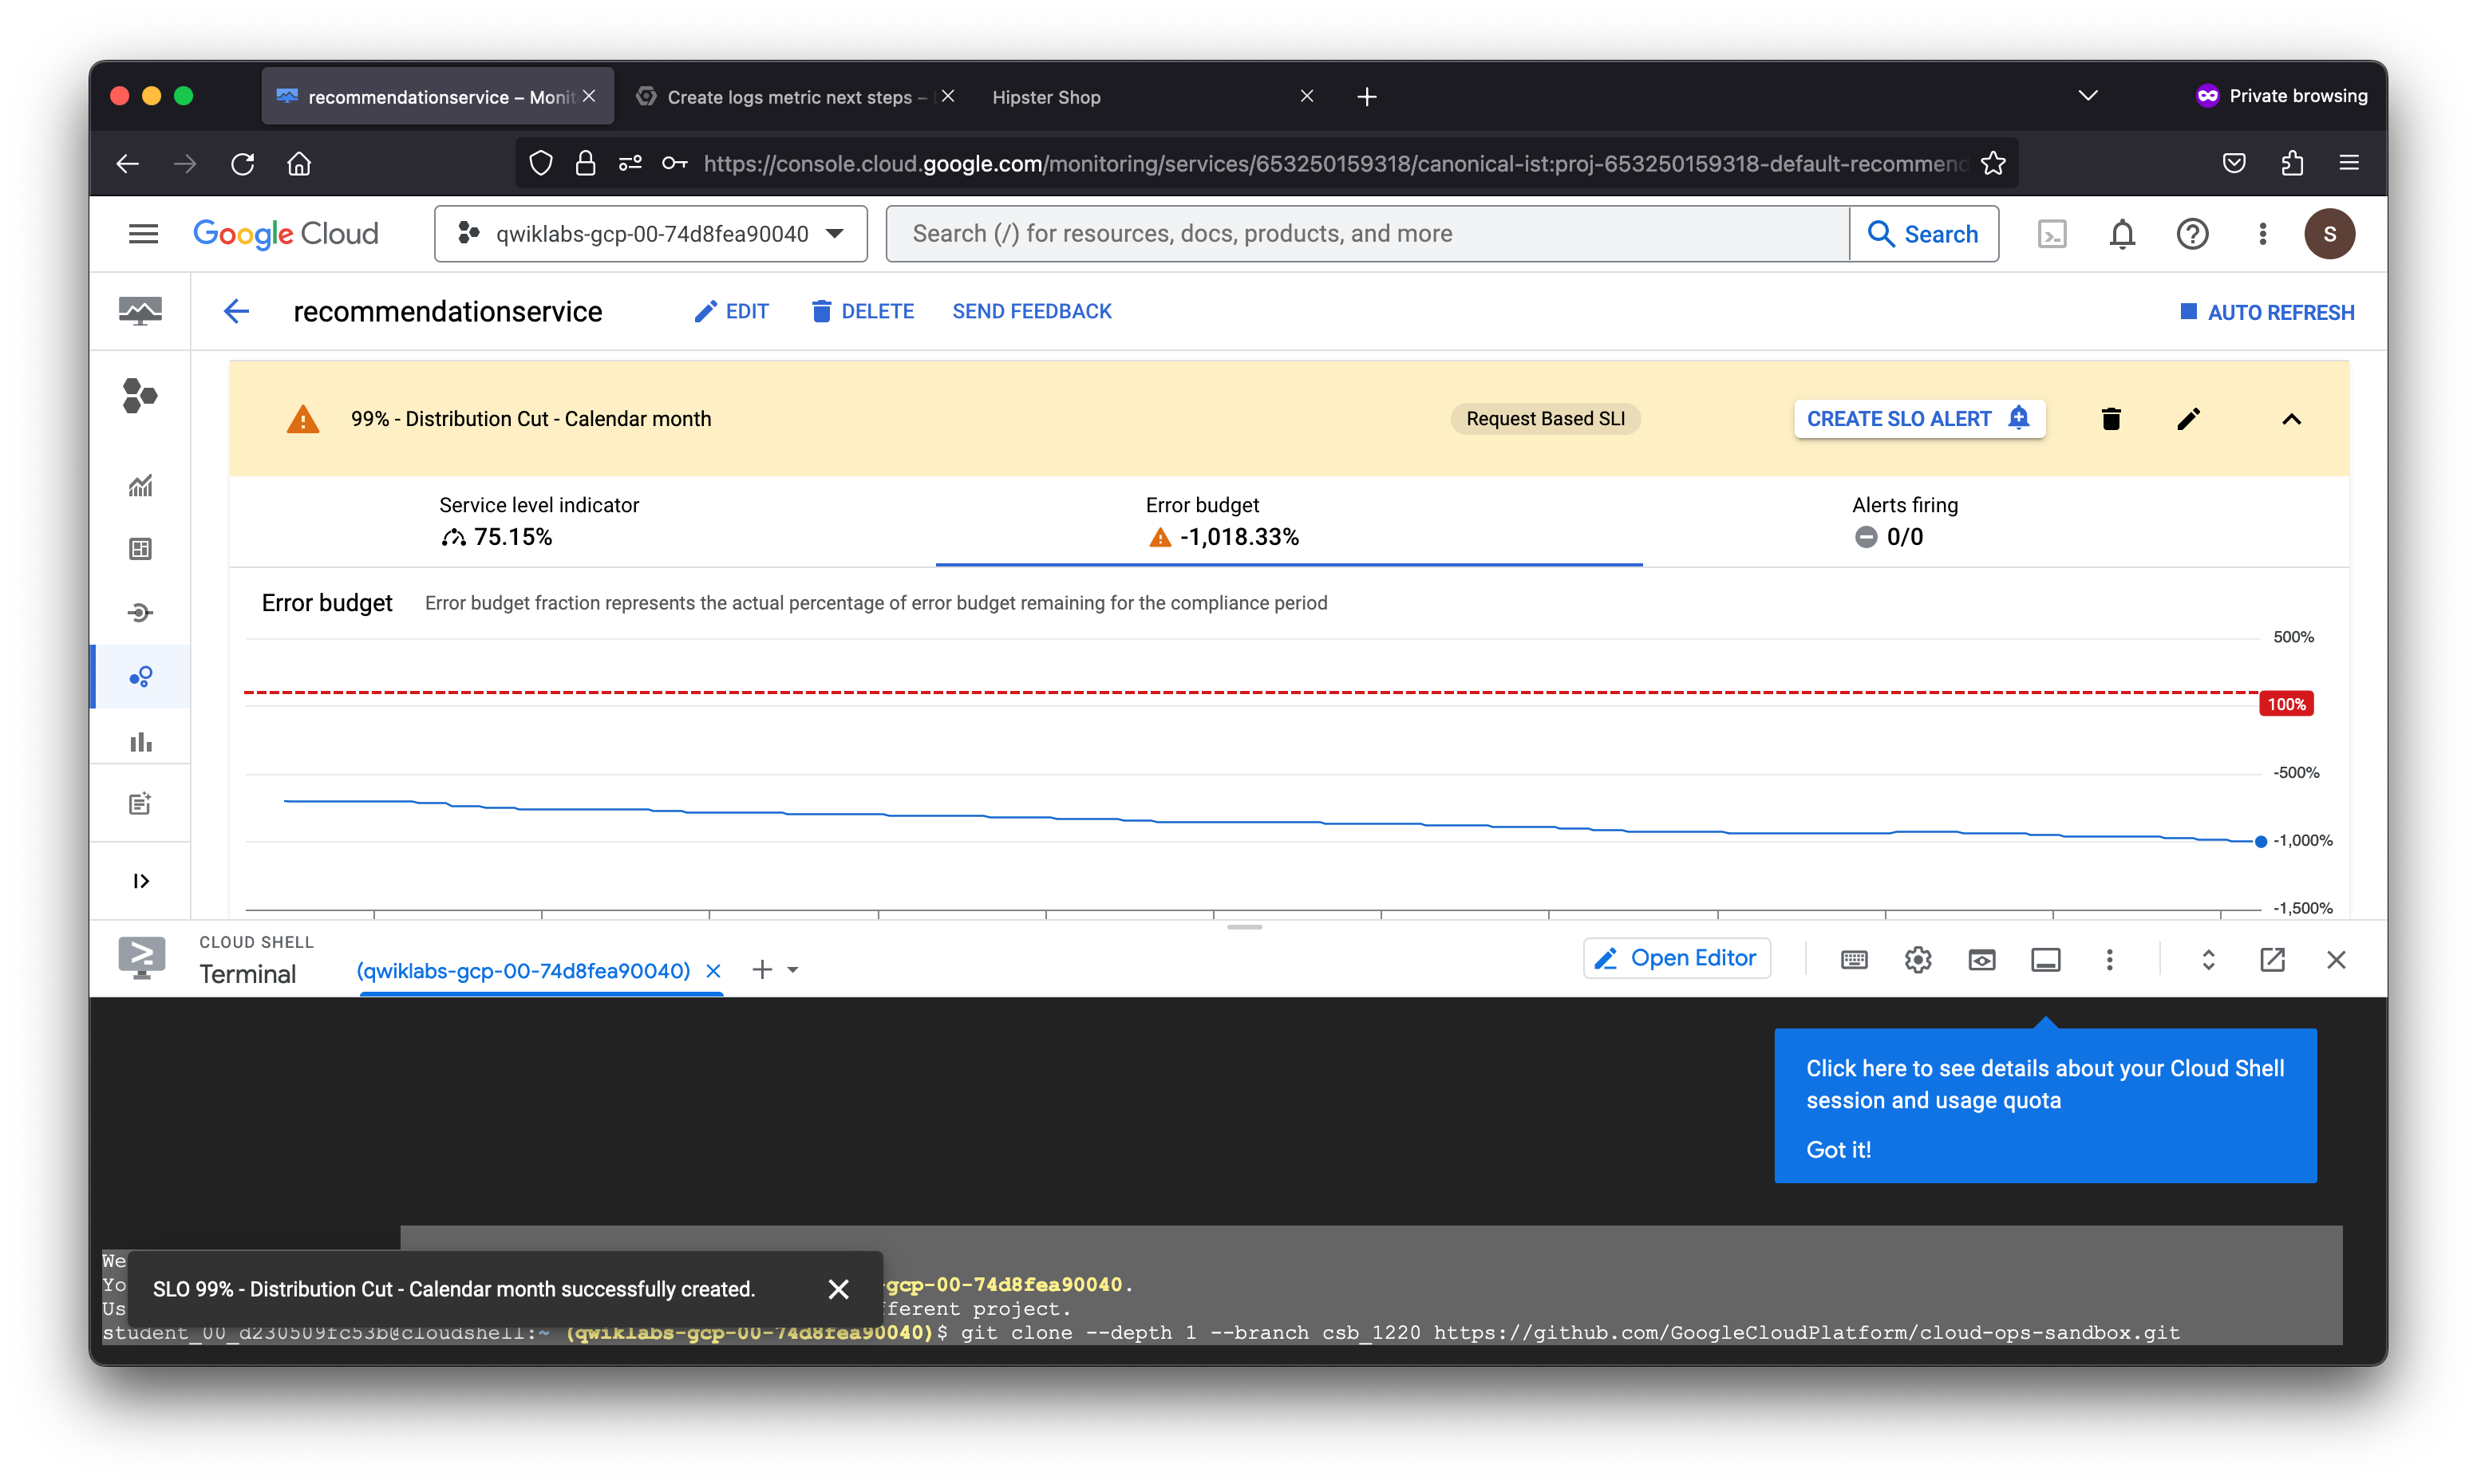
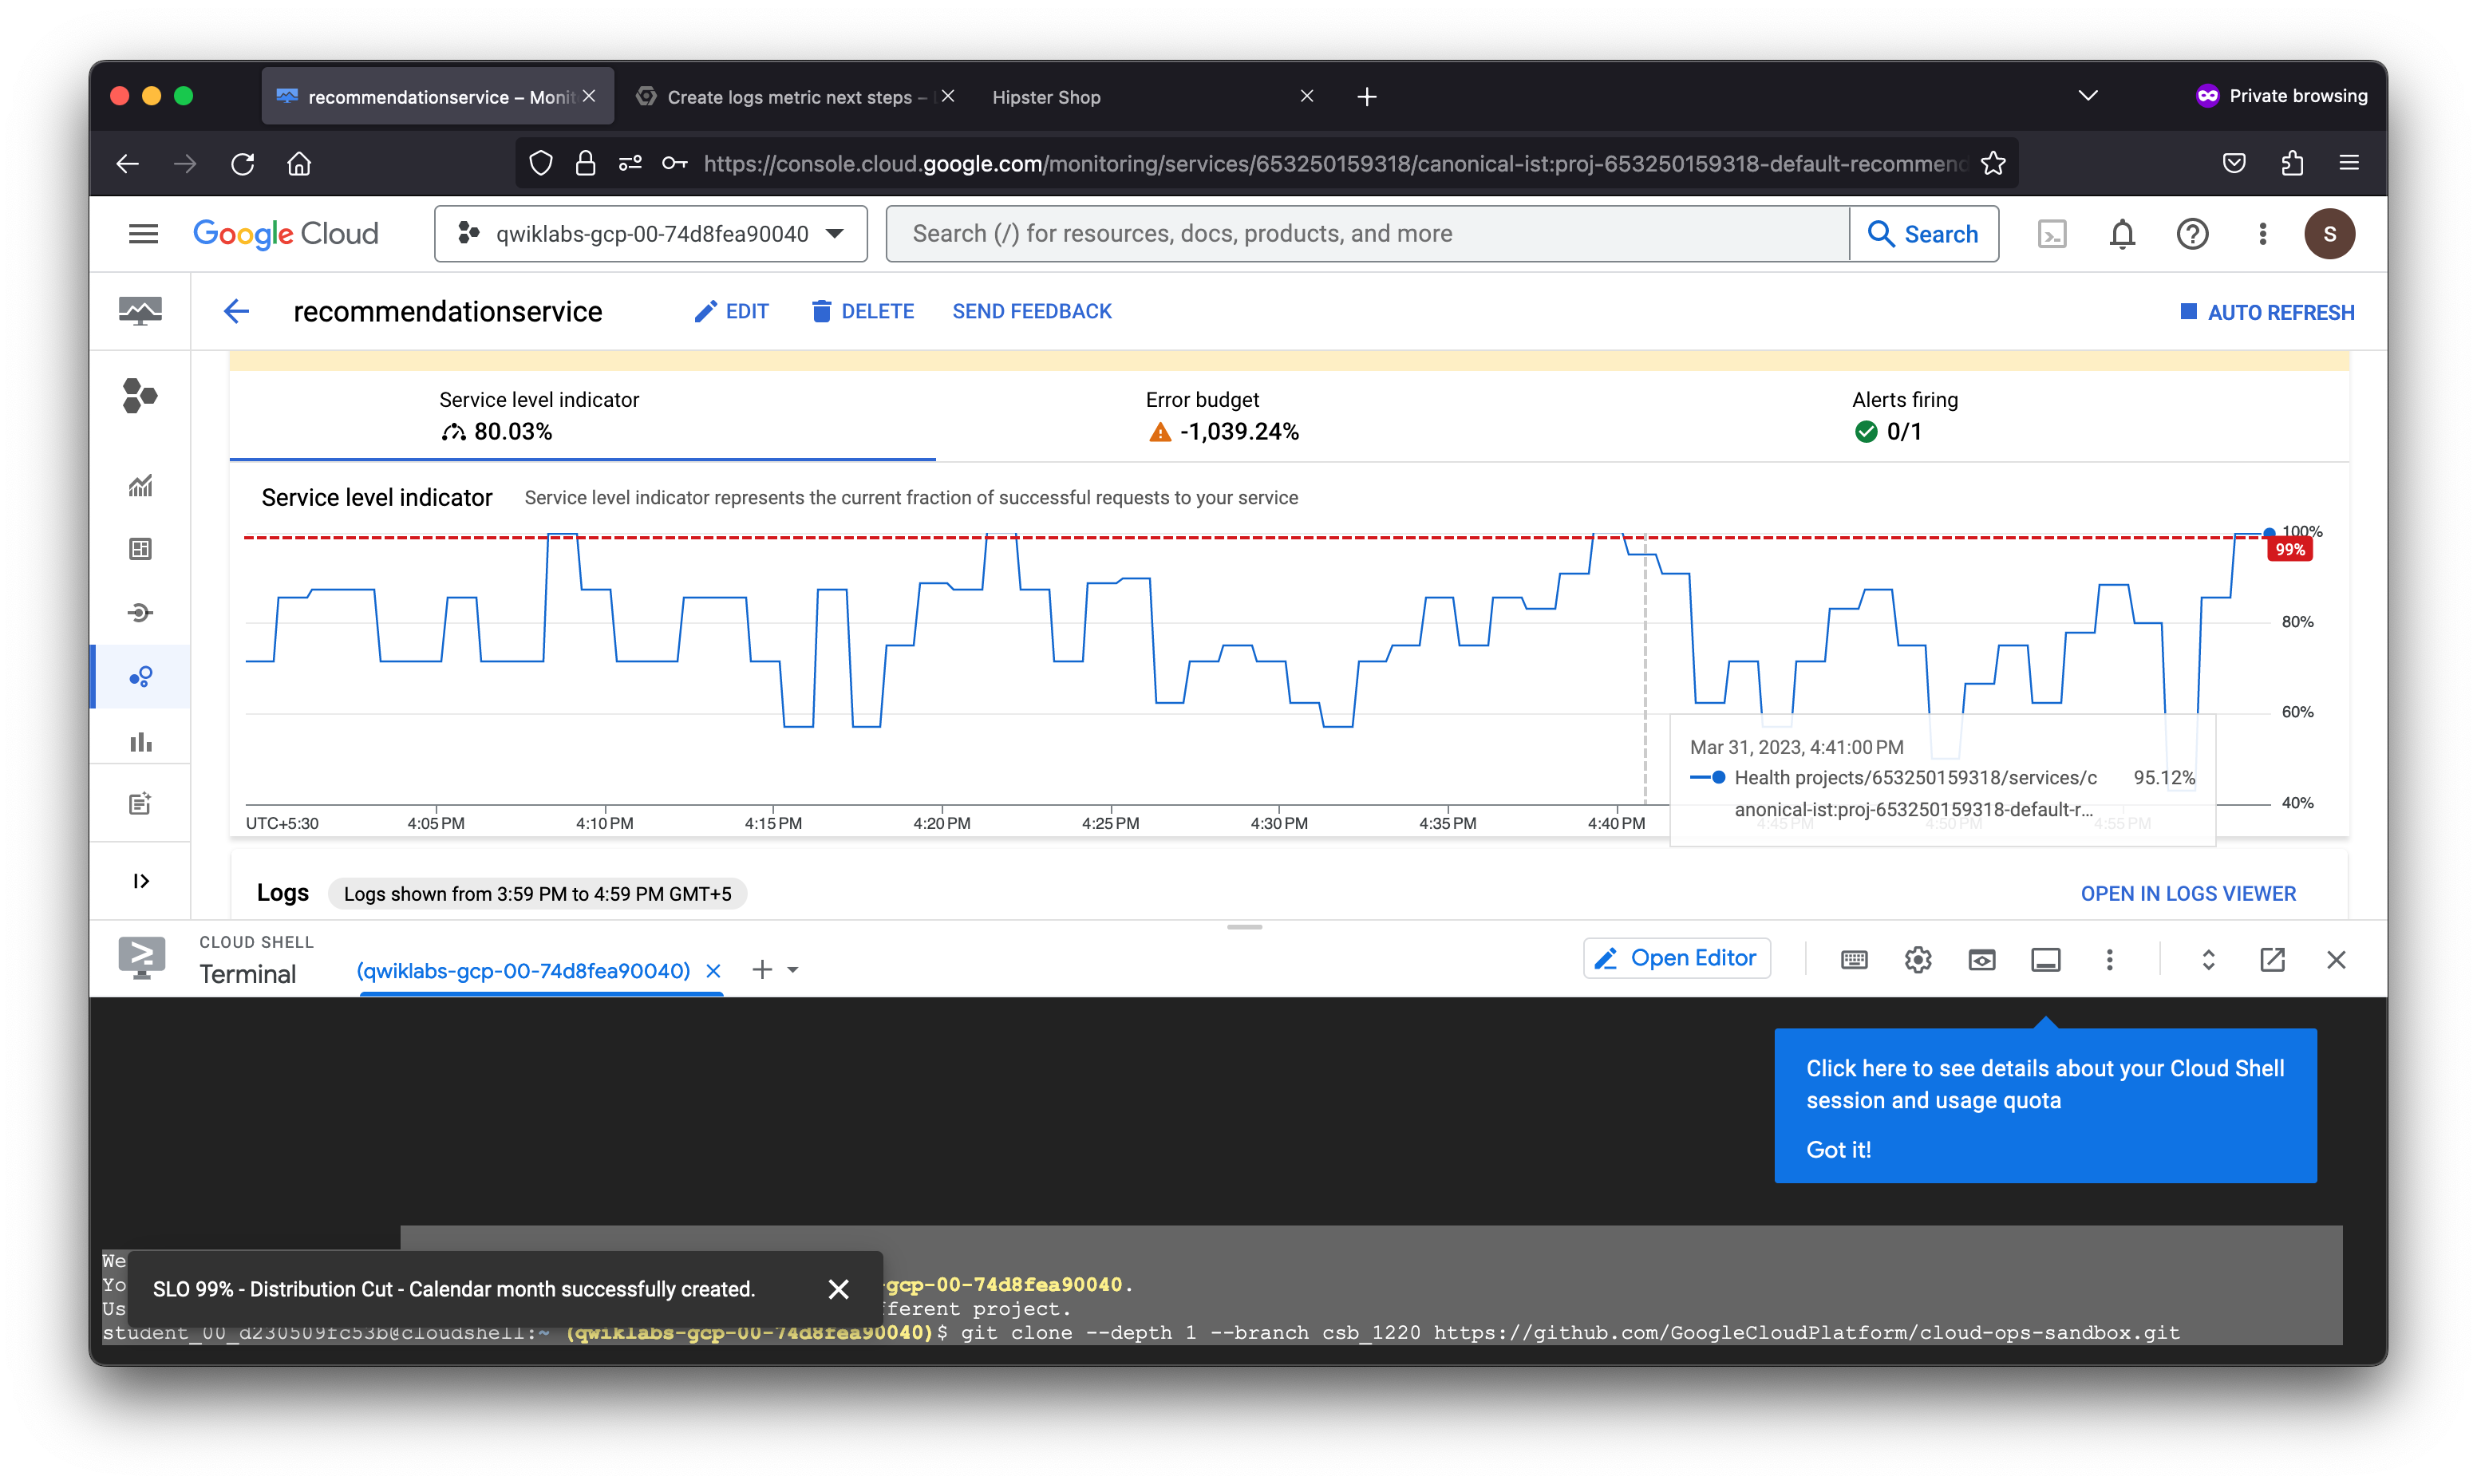
The Error budget fraction represents the actual percentage of error budget remaining for the compliance period. In the SLO defined, there is a period of one calendar month and a performance goal of 99% or better.
As denoted by the percentage, the error preventing product pages from loading properly in this fictitious scenario severely degraded the service-level objective defined. This may not be the case in a real world scenario as this lab ran a load test against the Kubernetes cluster hosting the application workload.
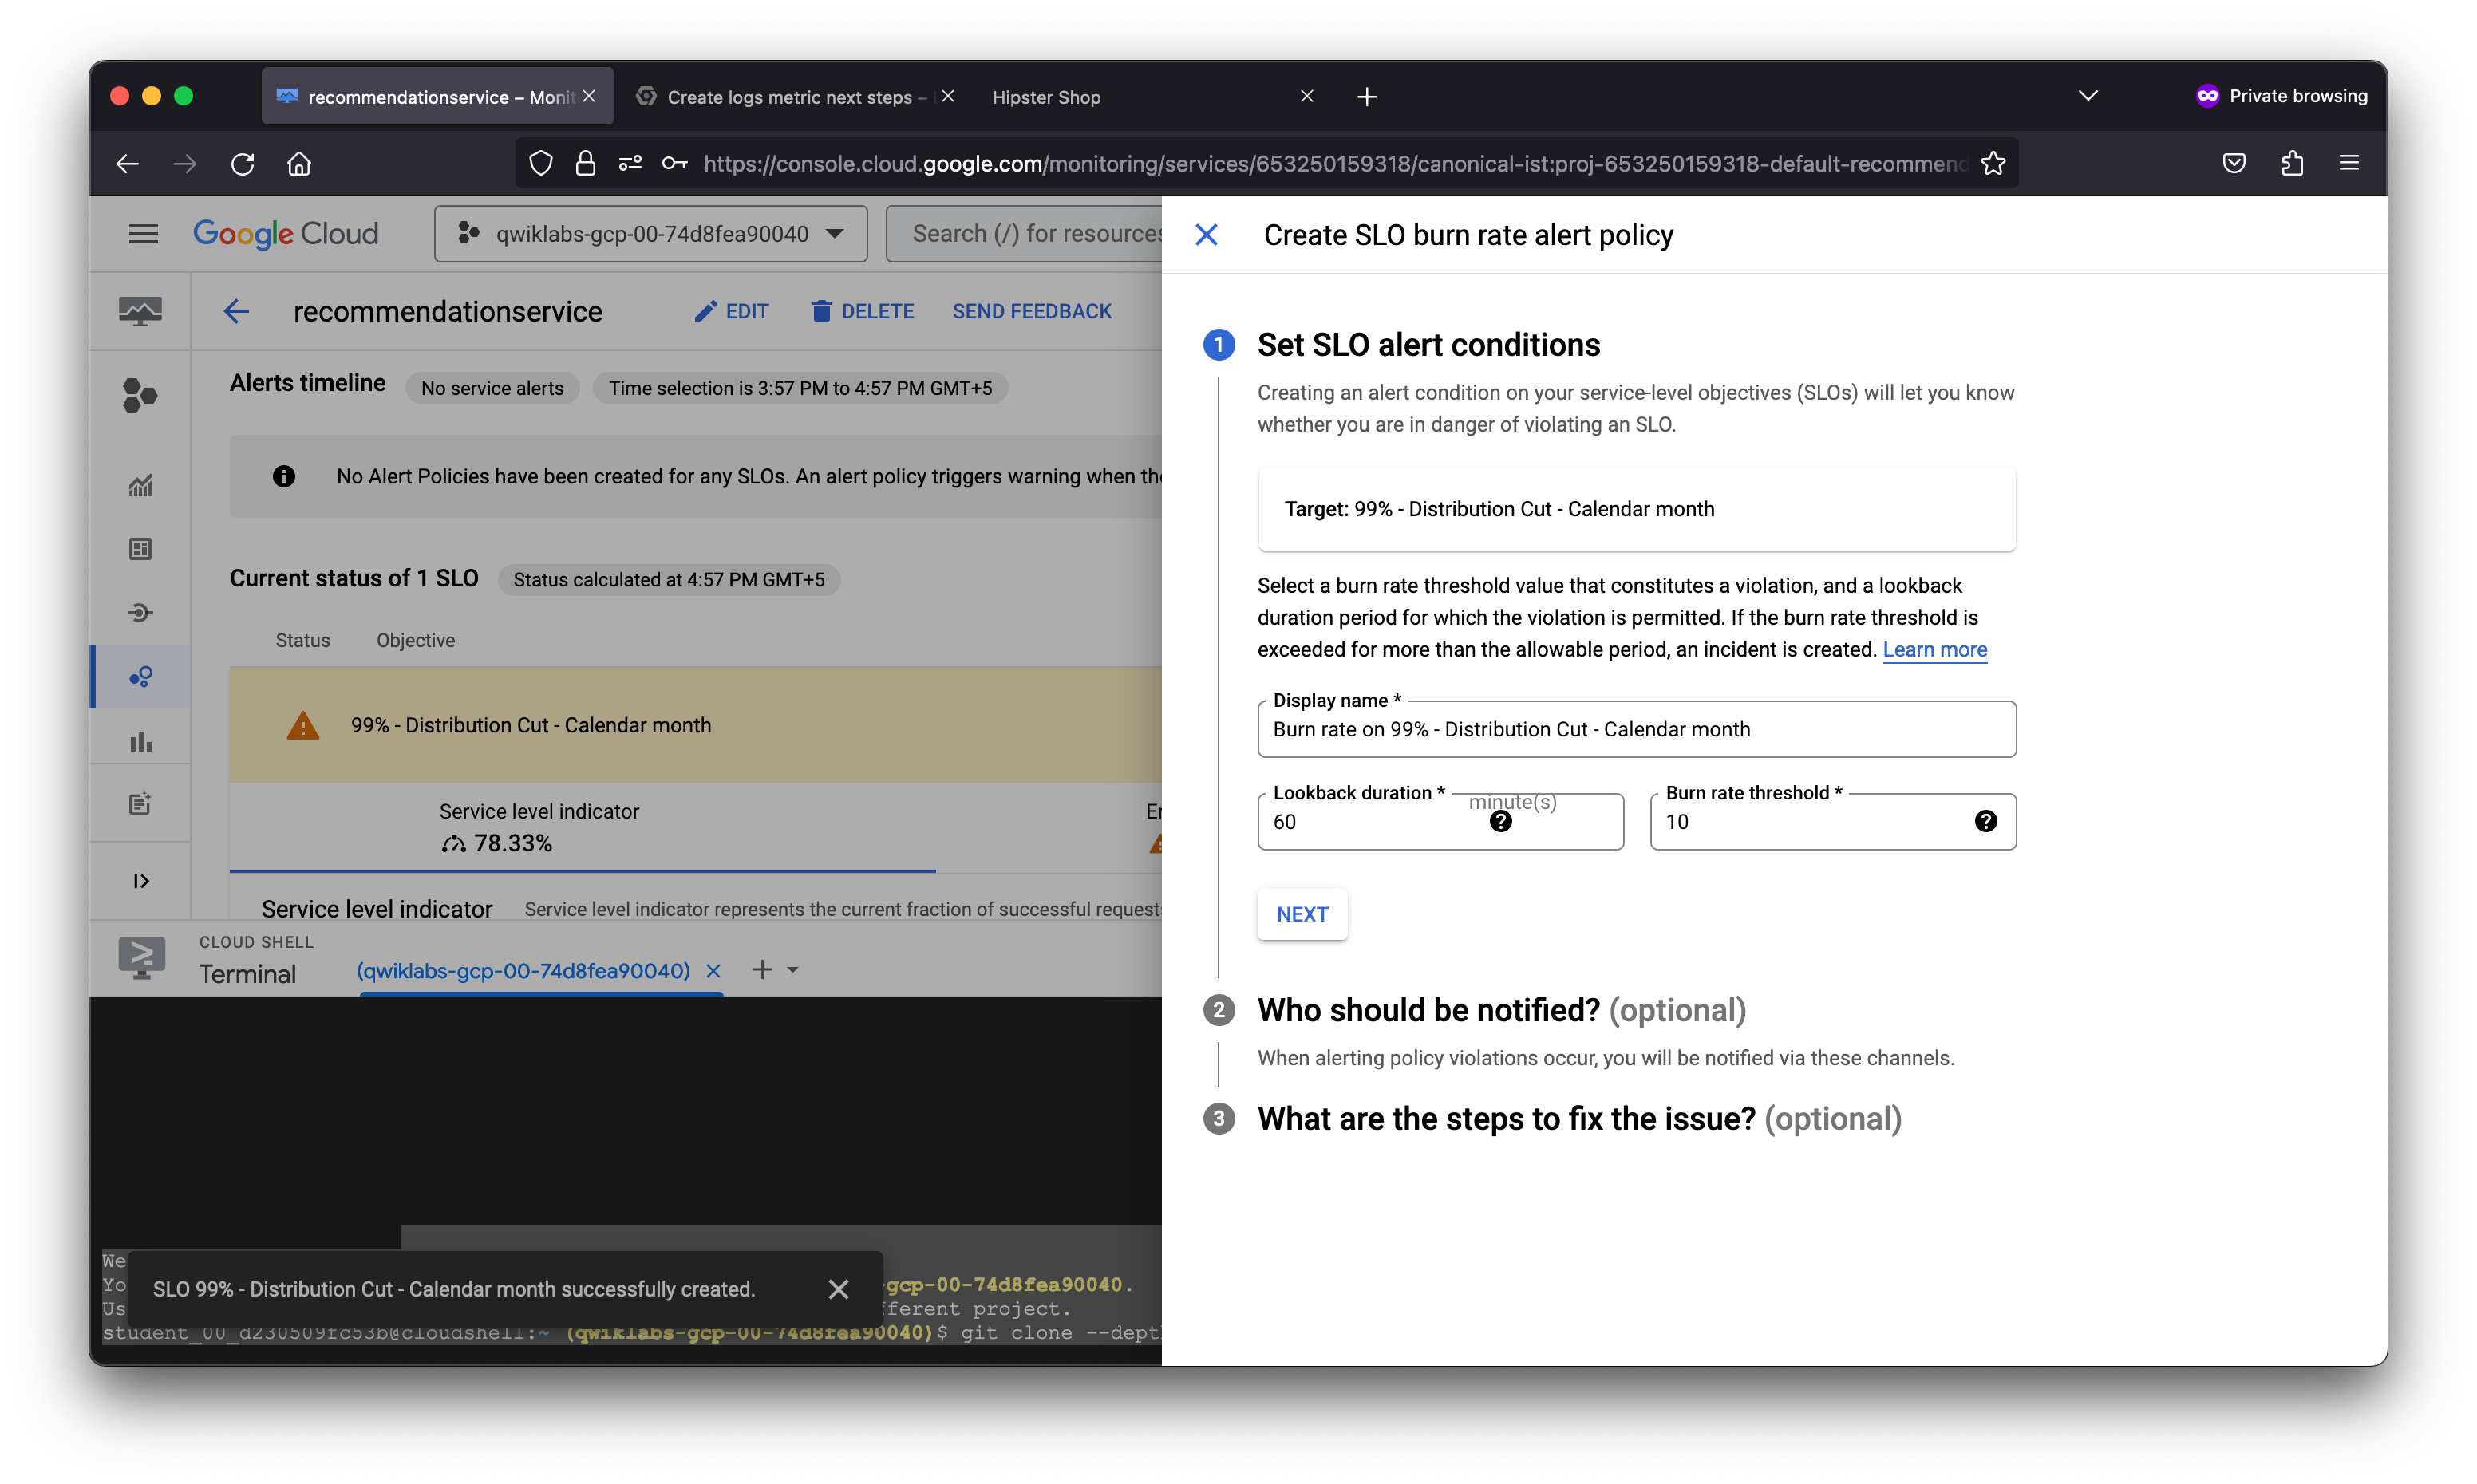
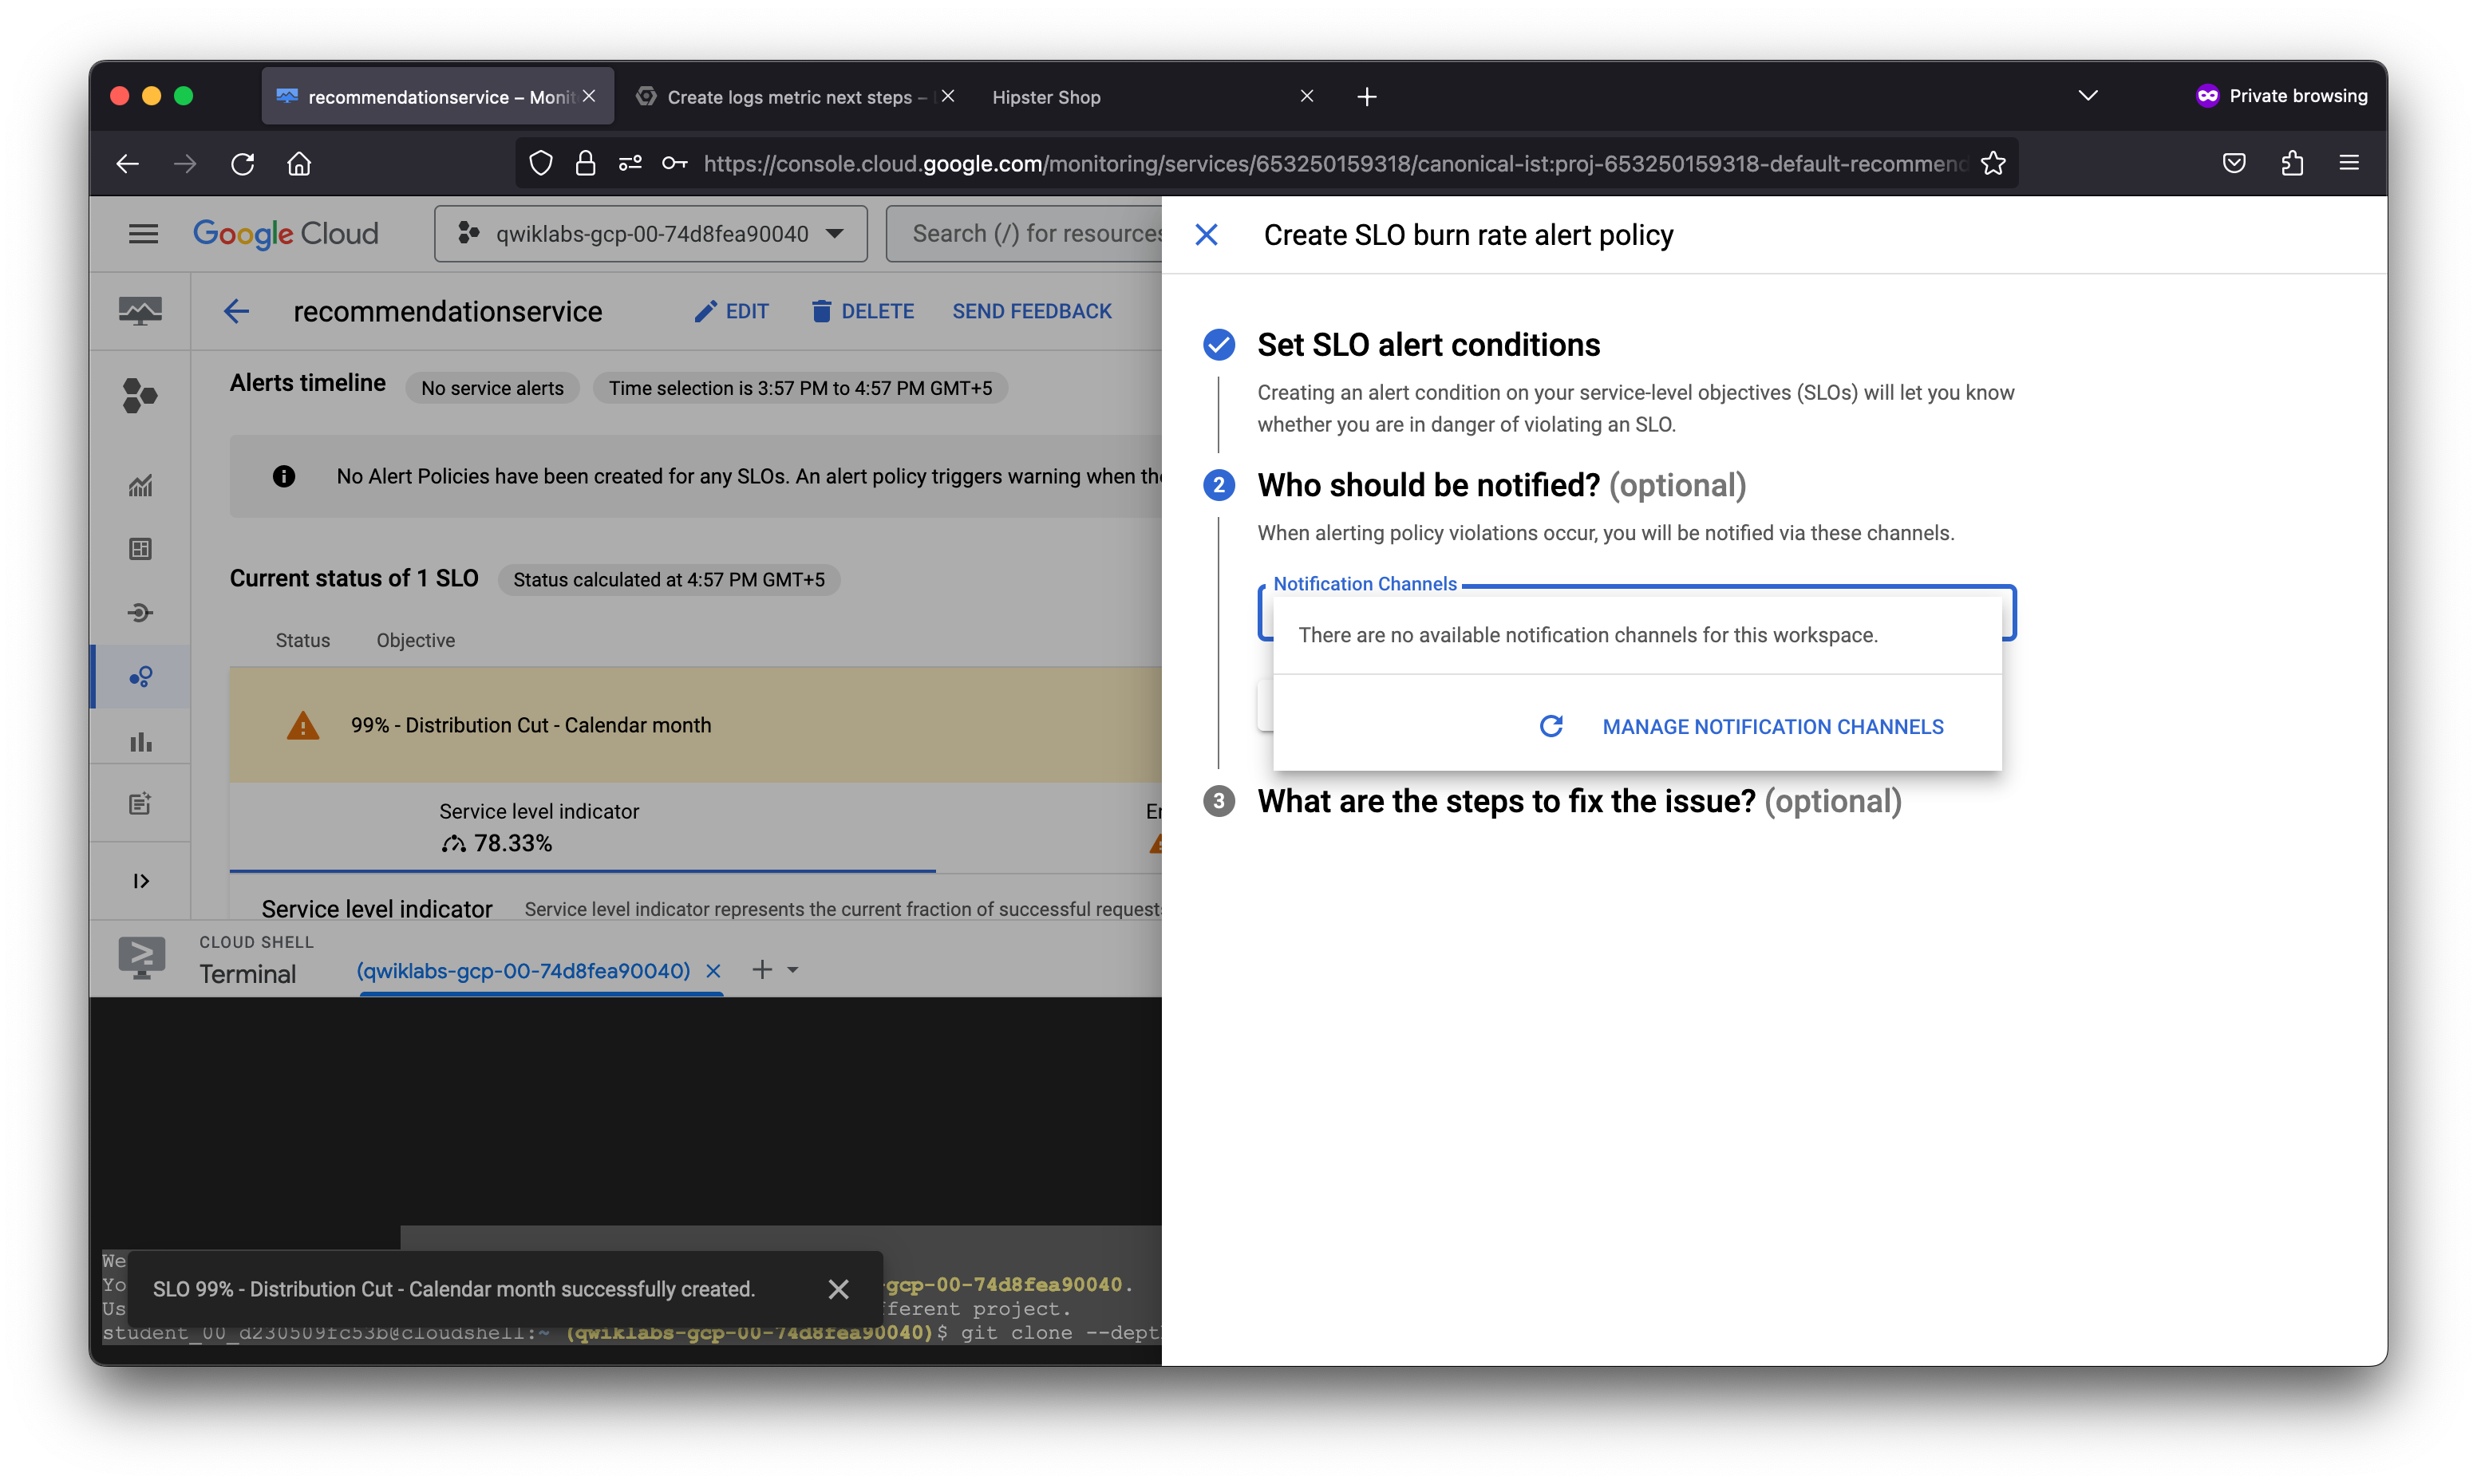
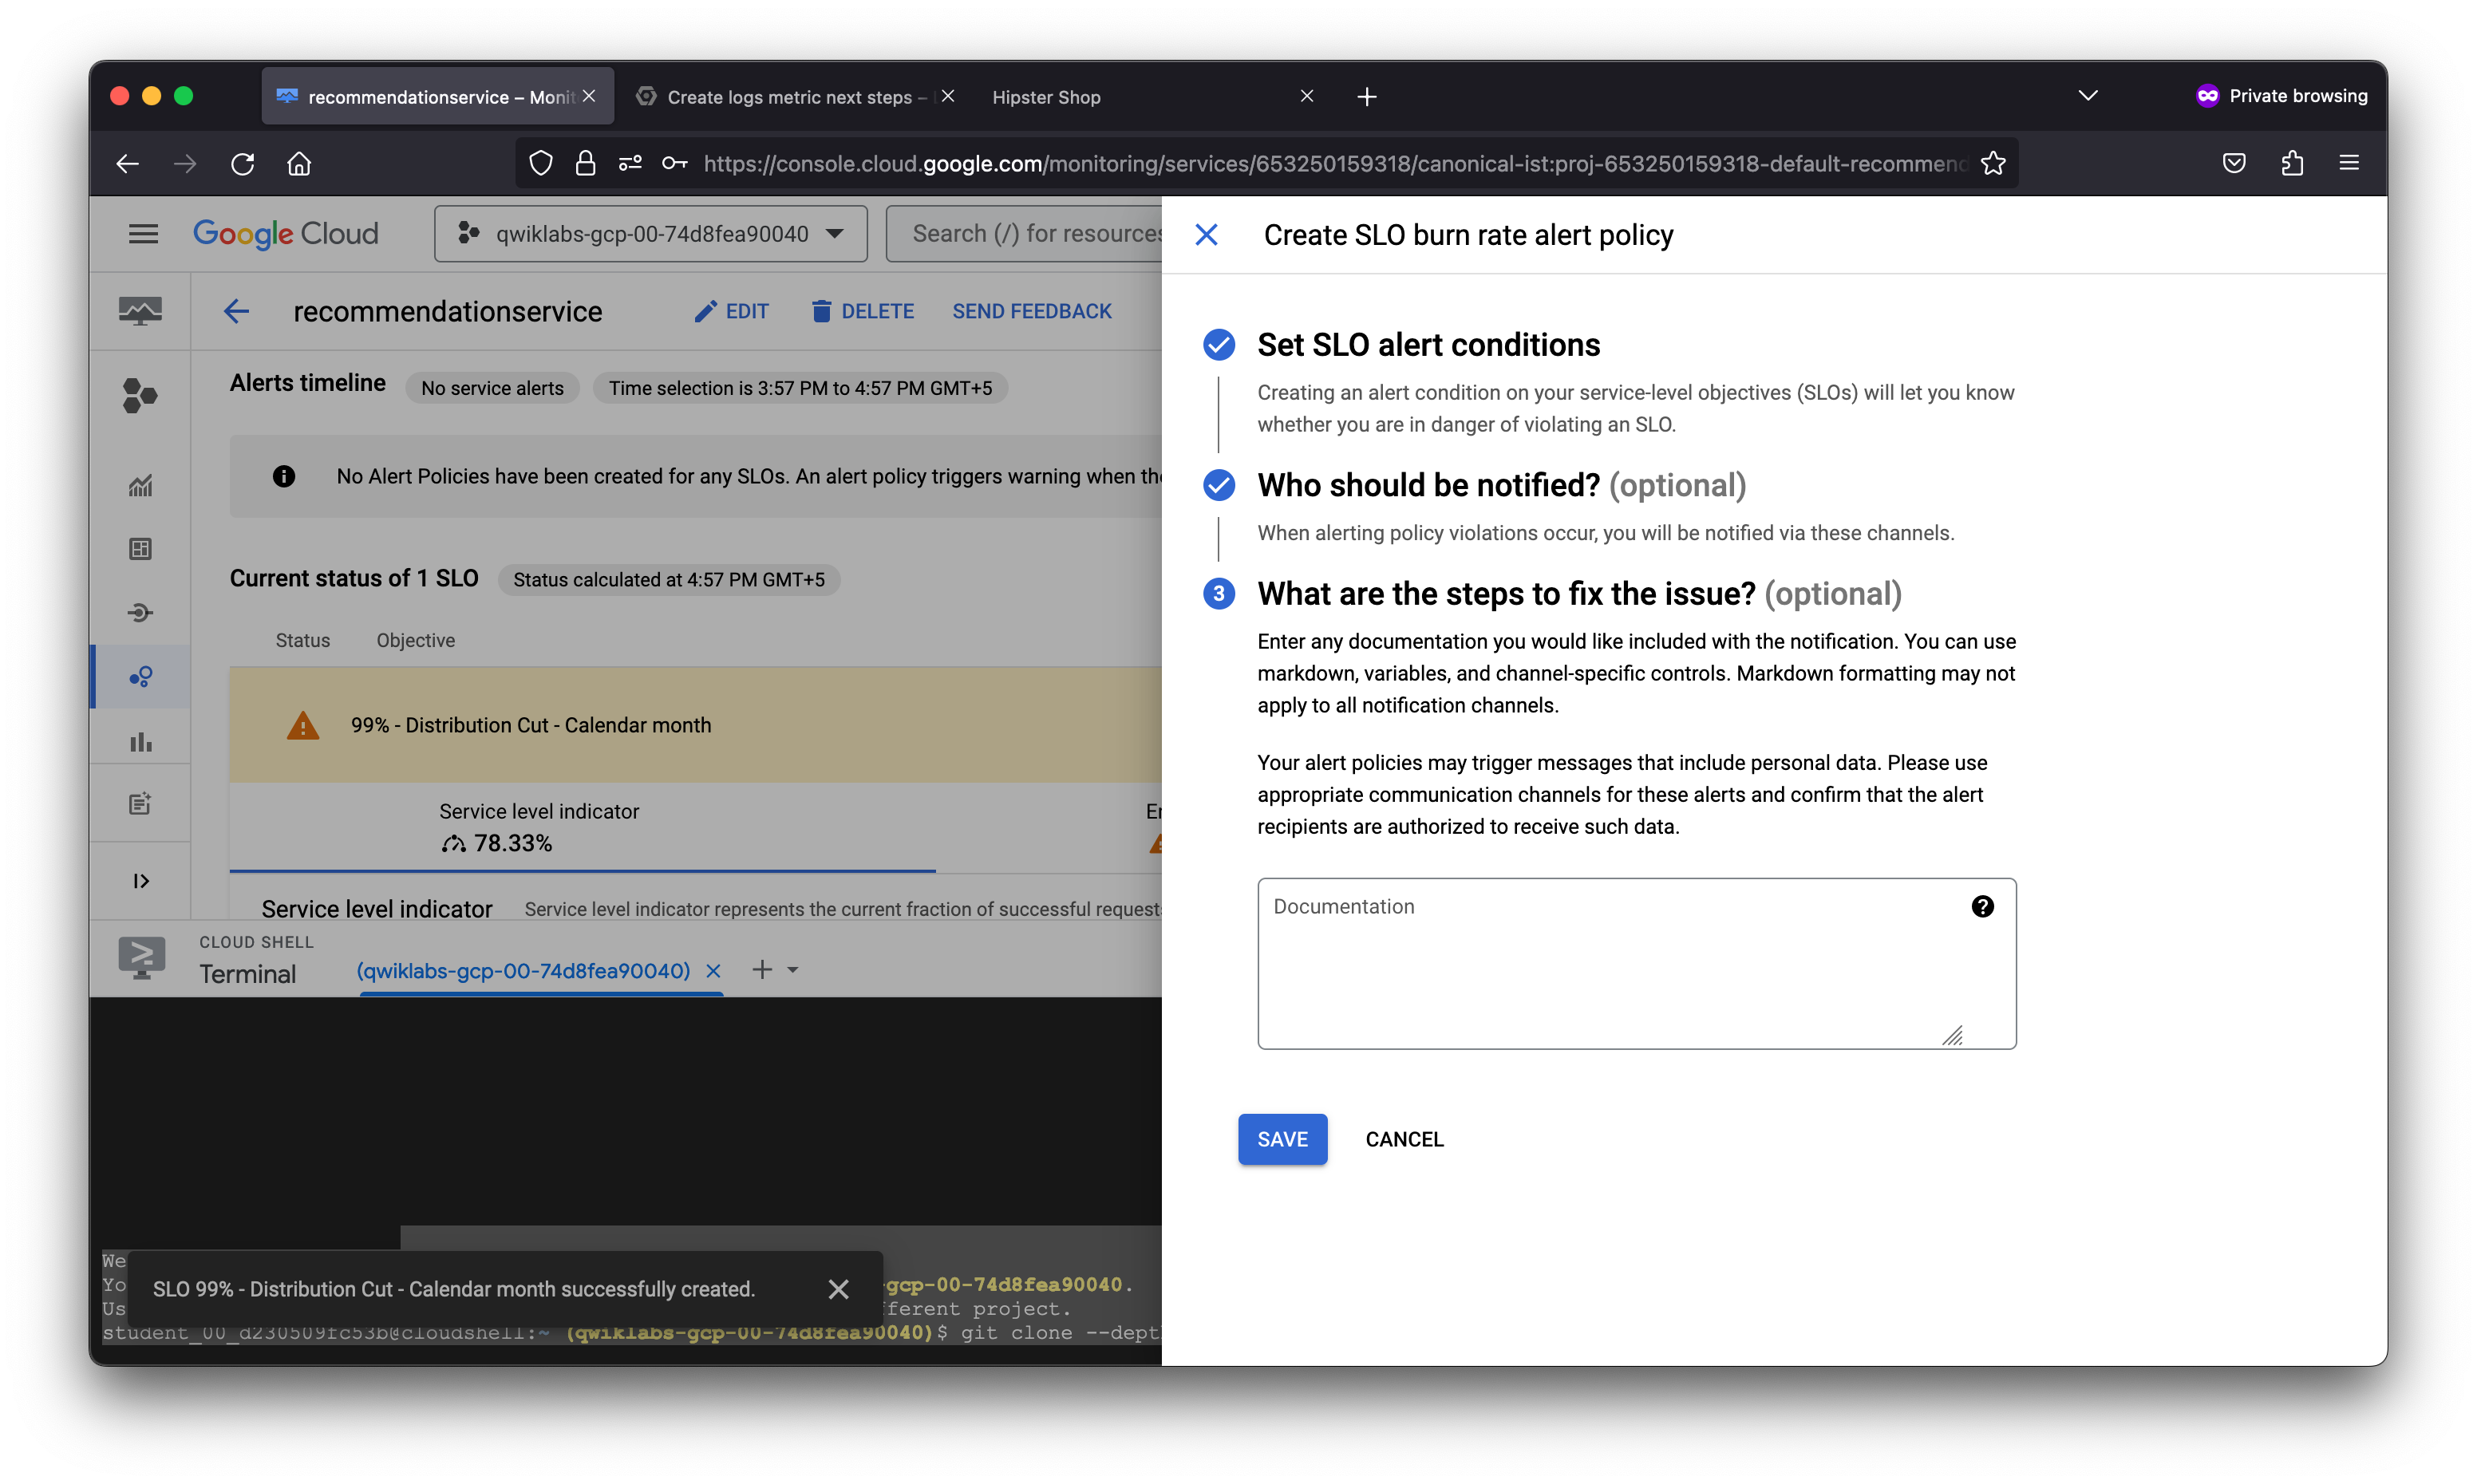
To proactively notify the SRE team of any violations of the SLO set, it is a best practice to define an alert that will trigger when the SLO is violated. The alert can invoke a notification channel of your choice, including: Email, SMS, PagerDuty, Slack, a WebHook or a subscription to a PubSub topic.
In this lab, you explored the Cloud Operations suite, which allows Site Reliability Engineers (SRE) to investigate and diagnose issues experienced with workloads deployed. In order to increase the reliability of workloads, you explored how to navigate resource pages or GKE, view operational data from GKE dashboards, create logs-based metrics to capture specific issues and proactively respond to incidents by setting service level objectives and alerts to proactively notify the SRE team about issues experienced before they cause outages.
