
Exploring Your Ecommerce Dataset with SQL in Google BigQuery
BigQuery is Google’s fully managed, NoOps, low cost analytics database. With BigQuery you can query terabytes and terabytes of data without having any infrastructure to manage or needing a database administrator. BigQuery uses SQL and can take advantage of the pay-as-you-go model. BigQuery allows you to focus on analyzing data to find meaningful insights.
We have a newly available ecommerce dataset that has millions of Google Analytics records for the Google Merchandise Store loaded into a table in BigQuery. In this lab, you use a copy of that dataset. Sample scenarios are provided, from which you look at the data and ways to remove duplicate information. The lab then steps you through further analysis the data.
- Access an ecommerce dataset
- Look at the dataset metadata
- Remove duplicate entries
- Write and execute queries
1. Pin the lab project in BigQuery
In this section, you add the data-to-insights project to your environment resources.
- Click Navigation menu > BigQuery.
The Welcome to BigQuery in the Cloud Console message box opens.
Note: The Welcome to BigQuery in the Cloud Console message box provides a link to the quickstart guide and UI updates.
- Click Done.
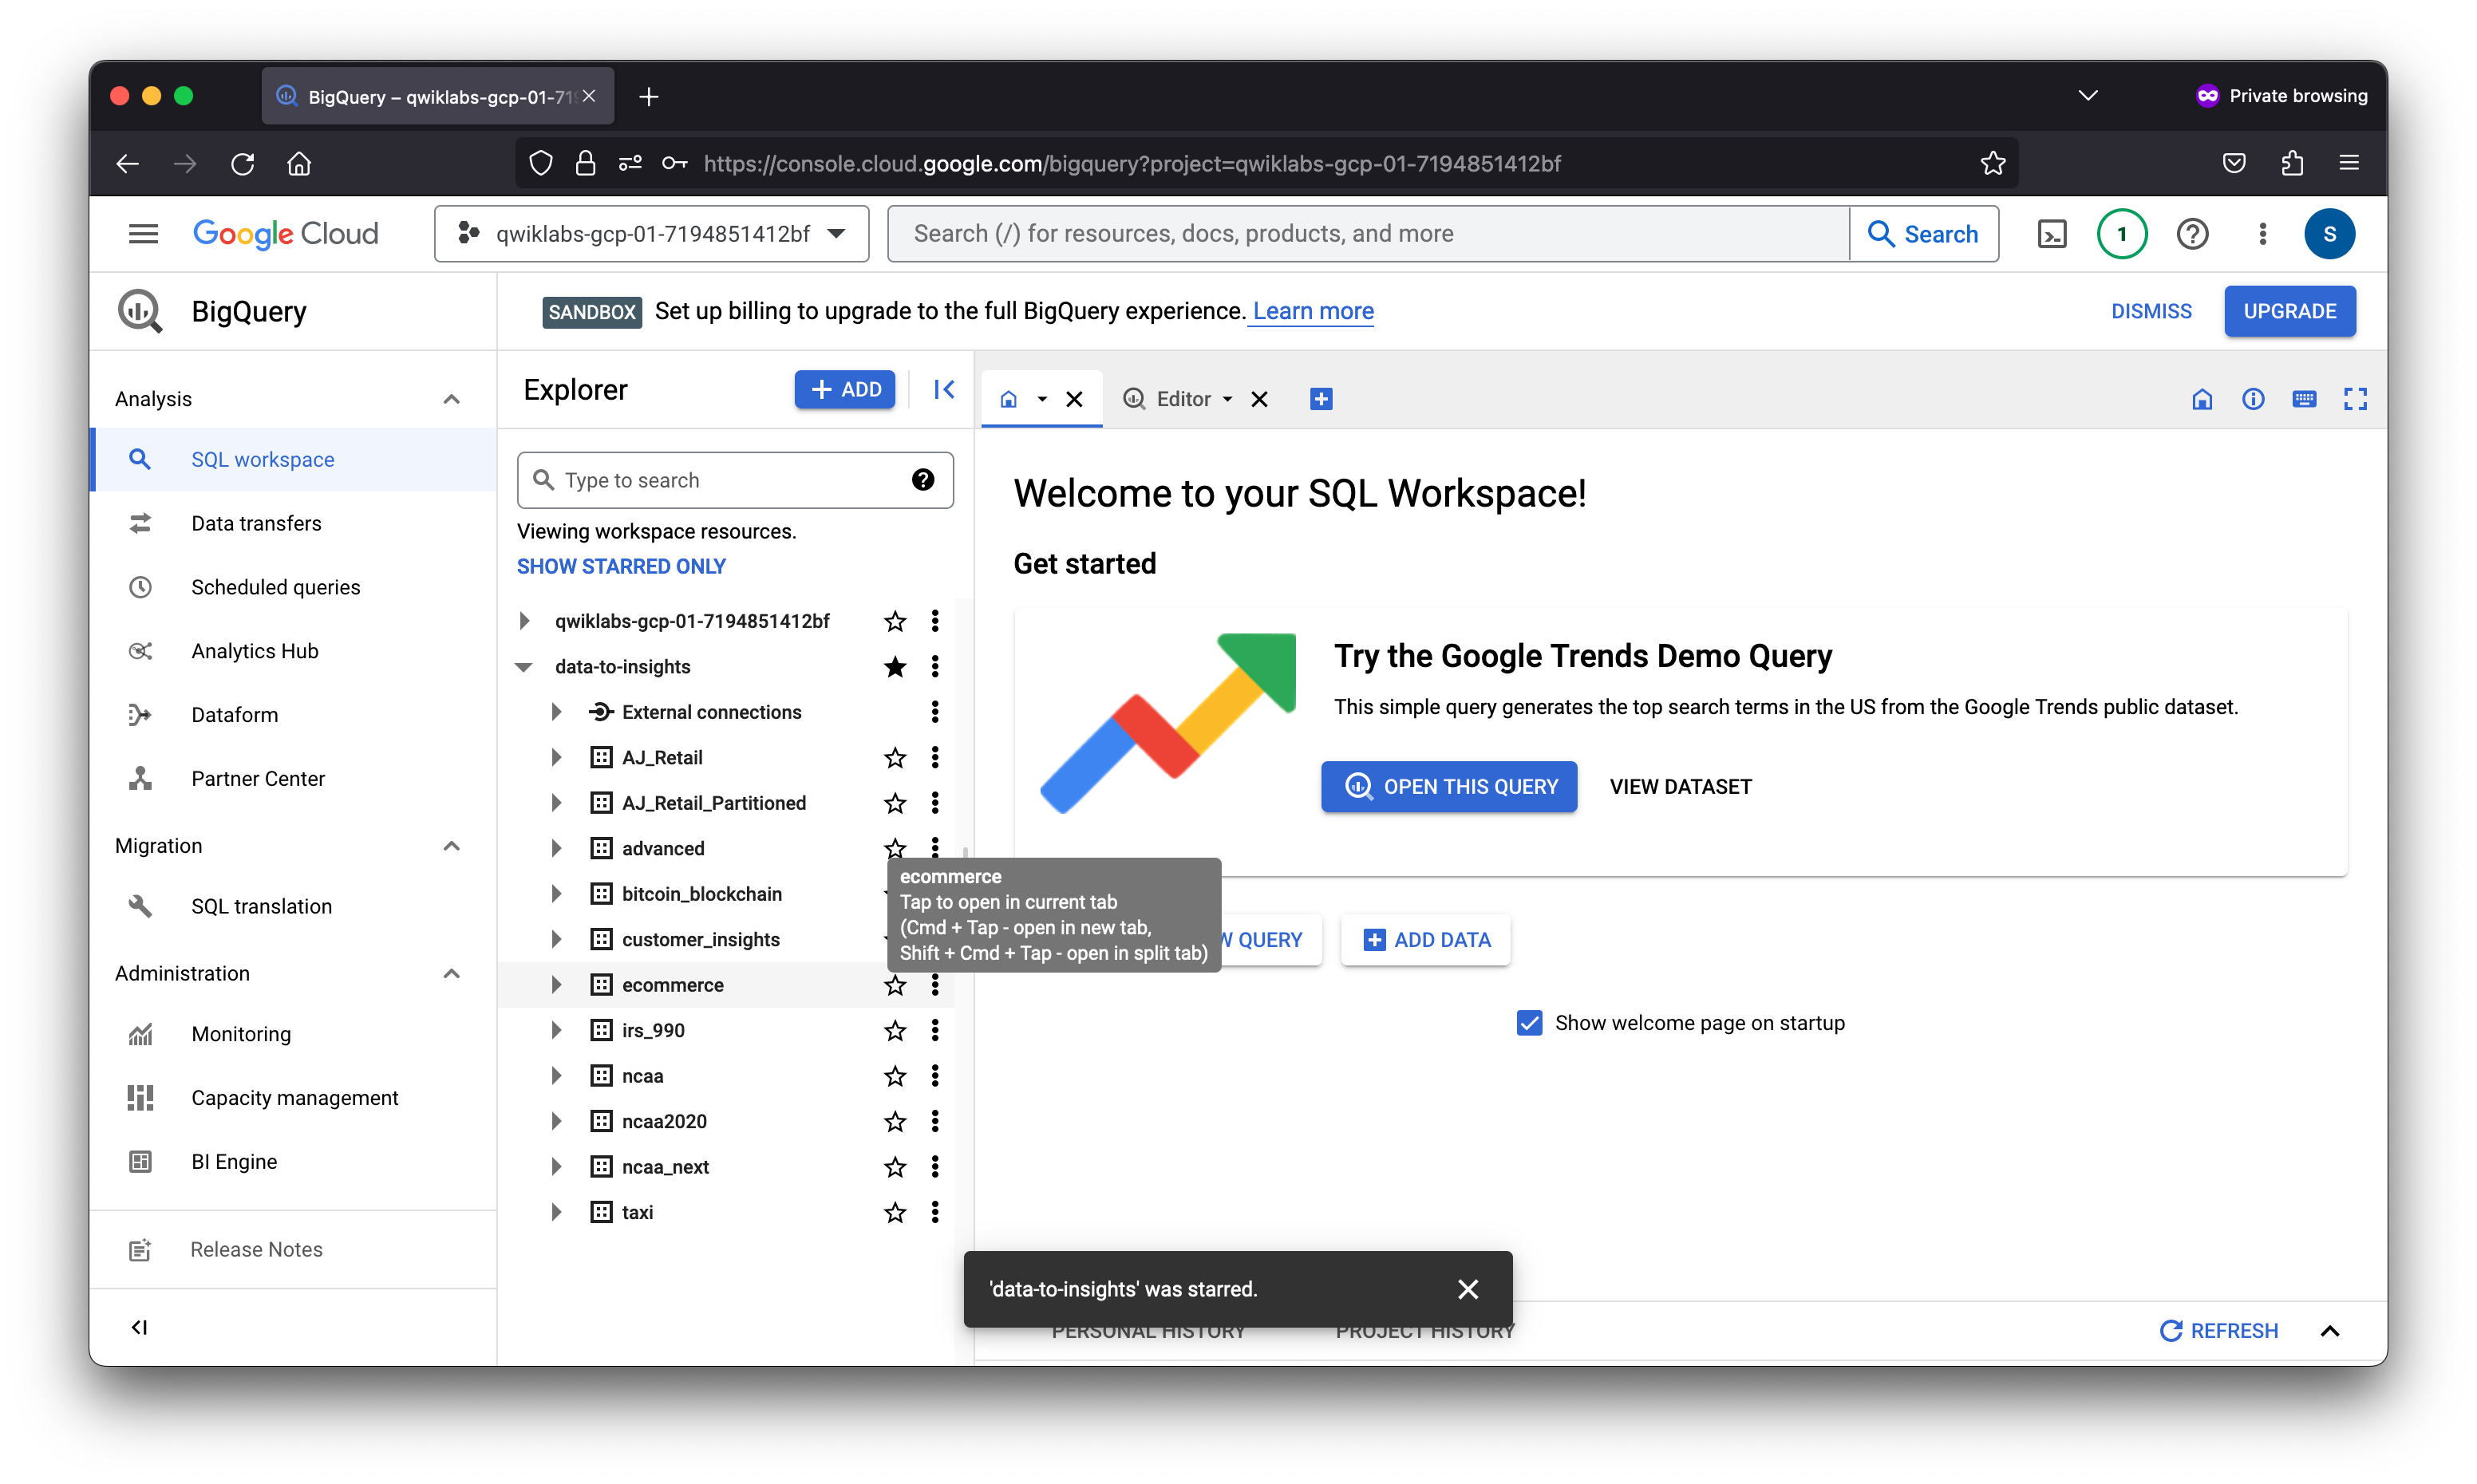
- BigQuery public datasets are not displayed by default in the BigQuery web UI. To open the public datasets project, copy “data-to-insights”.
- Click + Add > Star a project by name, then set the name to
data-to-insights. Click STAR.
The Explorer section now lists the data-to-insights project.
2. Explore ecommerce data and identify duplicate records
Scenario: Your data analyst team exported the Google Analytics logs for an ecommerce website into BigQuery and created a new table of all the raw ecommerce visitor session data.
Explore the all_sessions_raw table data:
- Click the Expand node icon near data-to-insights to expand the project.
- Expand ecommerce.
- Click all_sessions_raw.
In the right pane, a section opens that provides 3 views of the table data:
- Schema tab: Field name, Type, Mode, and Description; the logical constraints used to organize the data
- Details tab: Table metadata
- Preview tab: Table preview
- Click the Details tab to view the table metadata.
Identify duplicate rows
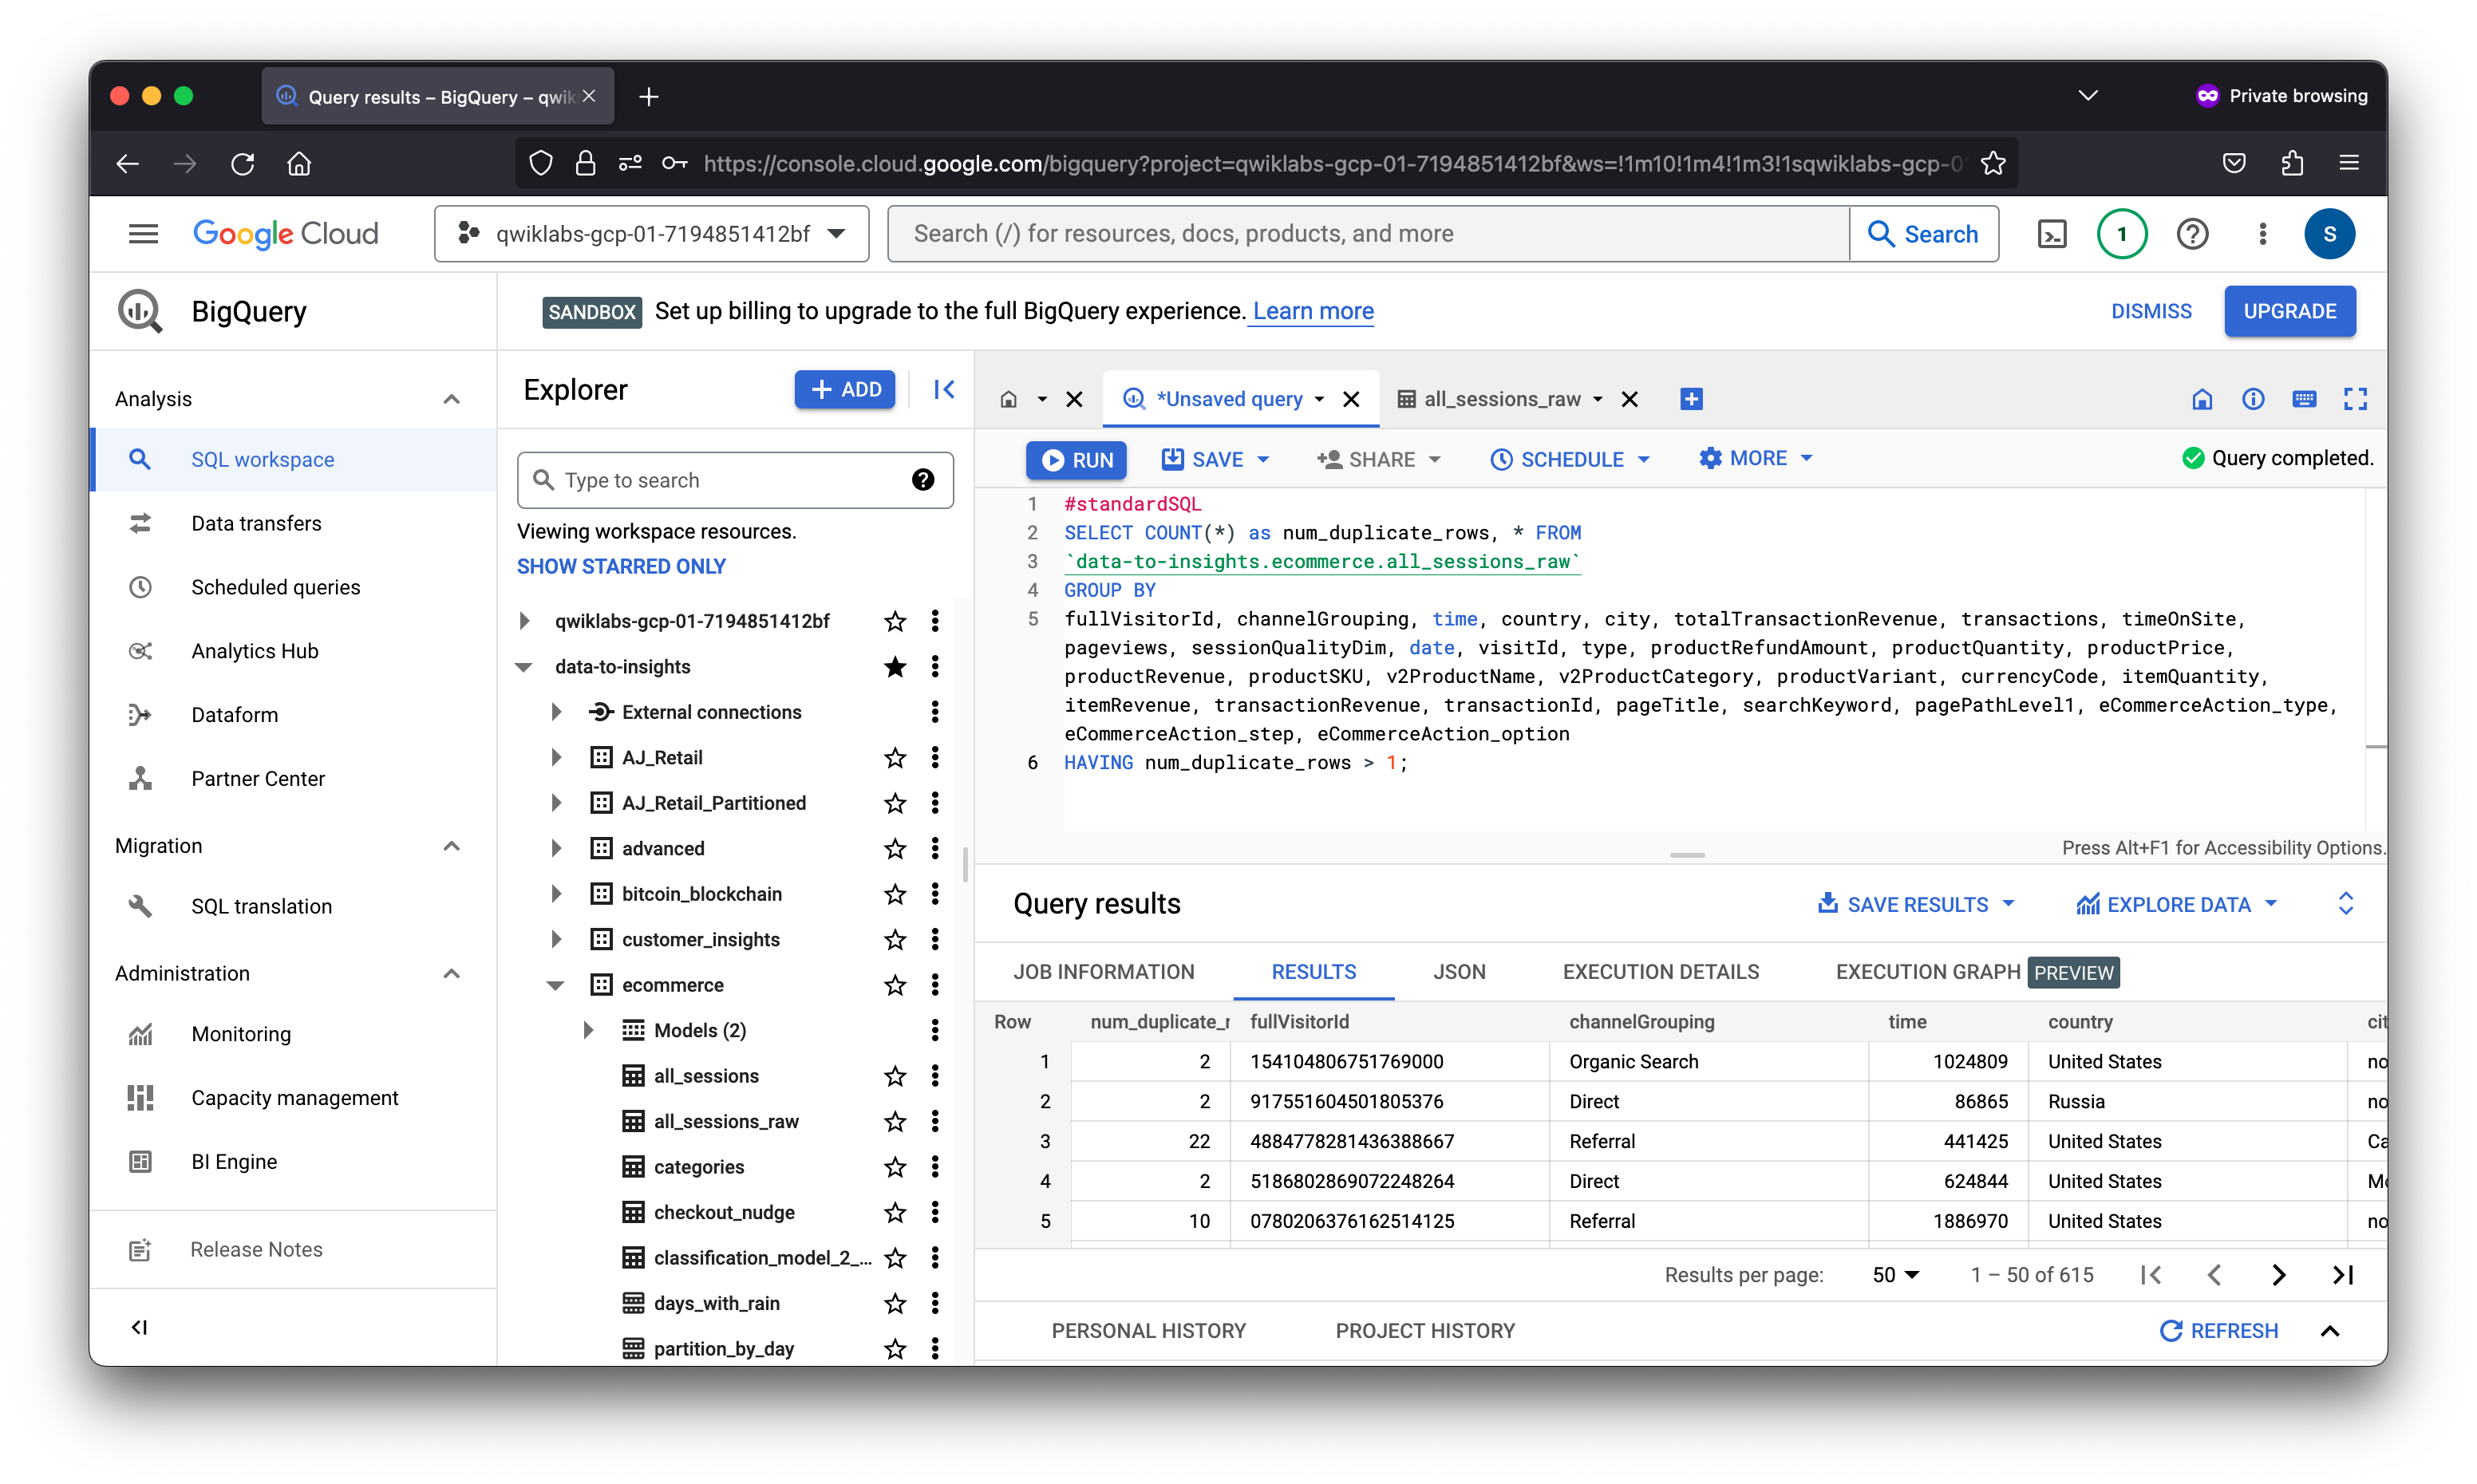
Seeing a sample amount of data may give you greater intuition for what is included in the dataset.
#standardSQL
SELECT COUNT(*) as num_duplicate_rows, * FROM
`data-to-insights.ecommerce.all_sessions_raw`
GROUP BY
fullVisitorId, channelGrouping, time, country, city, totalTransactionRevenue, transactions, timeOnSite, pageviews, sessionQualityDim, date, visitId, type, productRefundAmount, productQuantity, productPrice, productRevenue, productSKU, v2ProductName, v2ProductCategory, productVariant, currencyCode, itemQuantity, itemRevenue, transactionRevenue, transactionId, pageTitle, searchKeyword, pagePathLevel1, eCommerceAction_type, eCommerceAction_step, eCommerceAction_option
HAVING num_duplicate_rows > 1;
Analyze the new all_sessions table
In this section, you use a deduplicated table called all_sessions.
Scenario: Your data analyst team has provided you with this query, and your schema experts have identified the key fields that must be unique for each record per your schema.
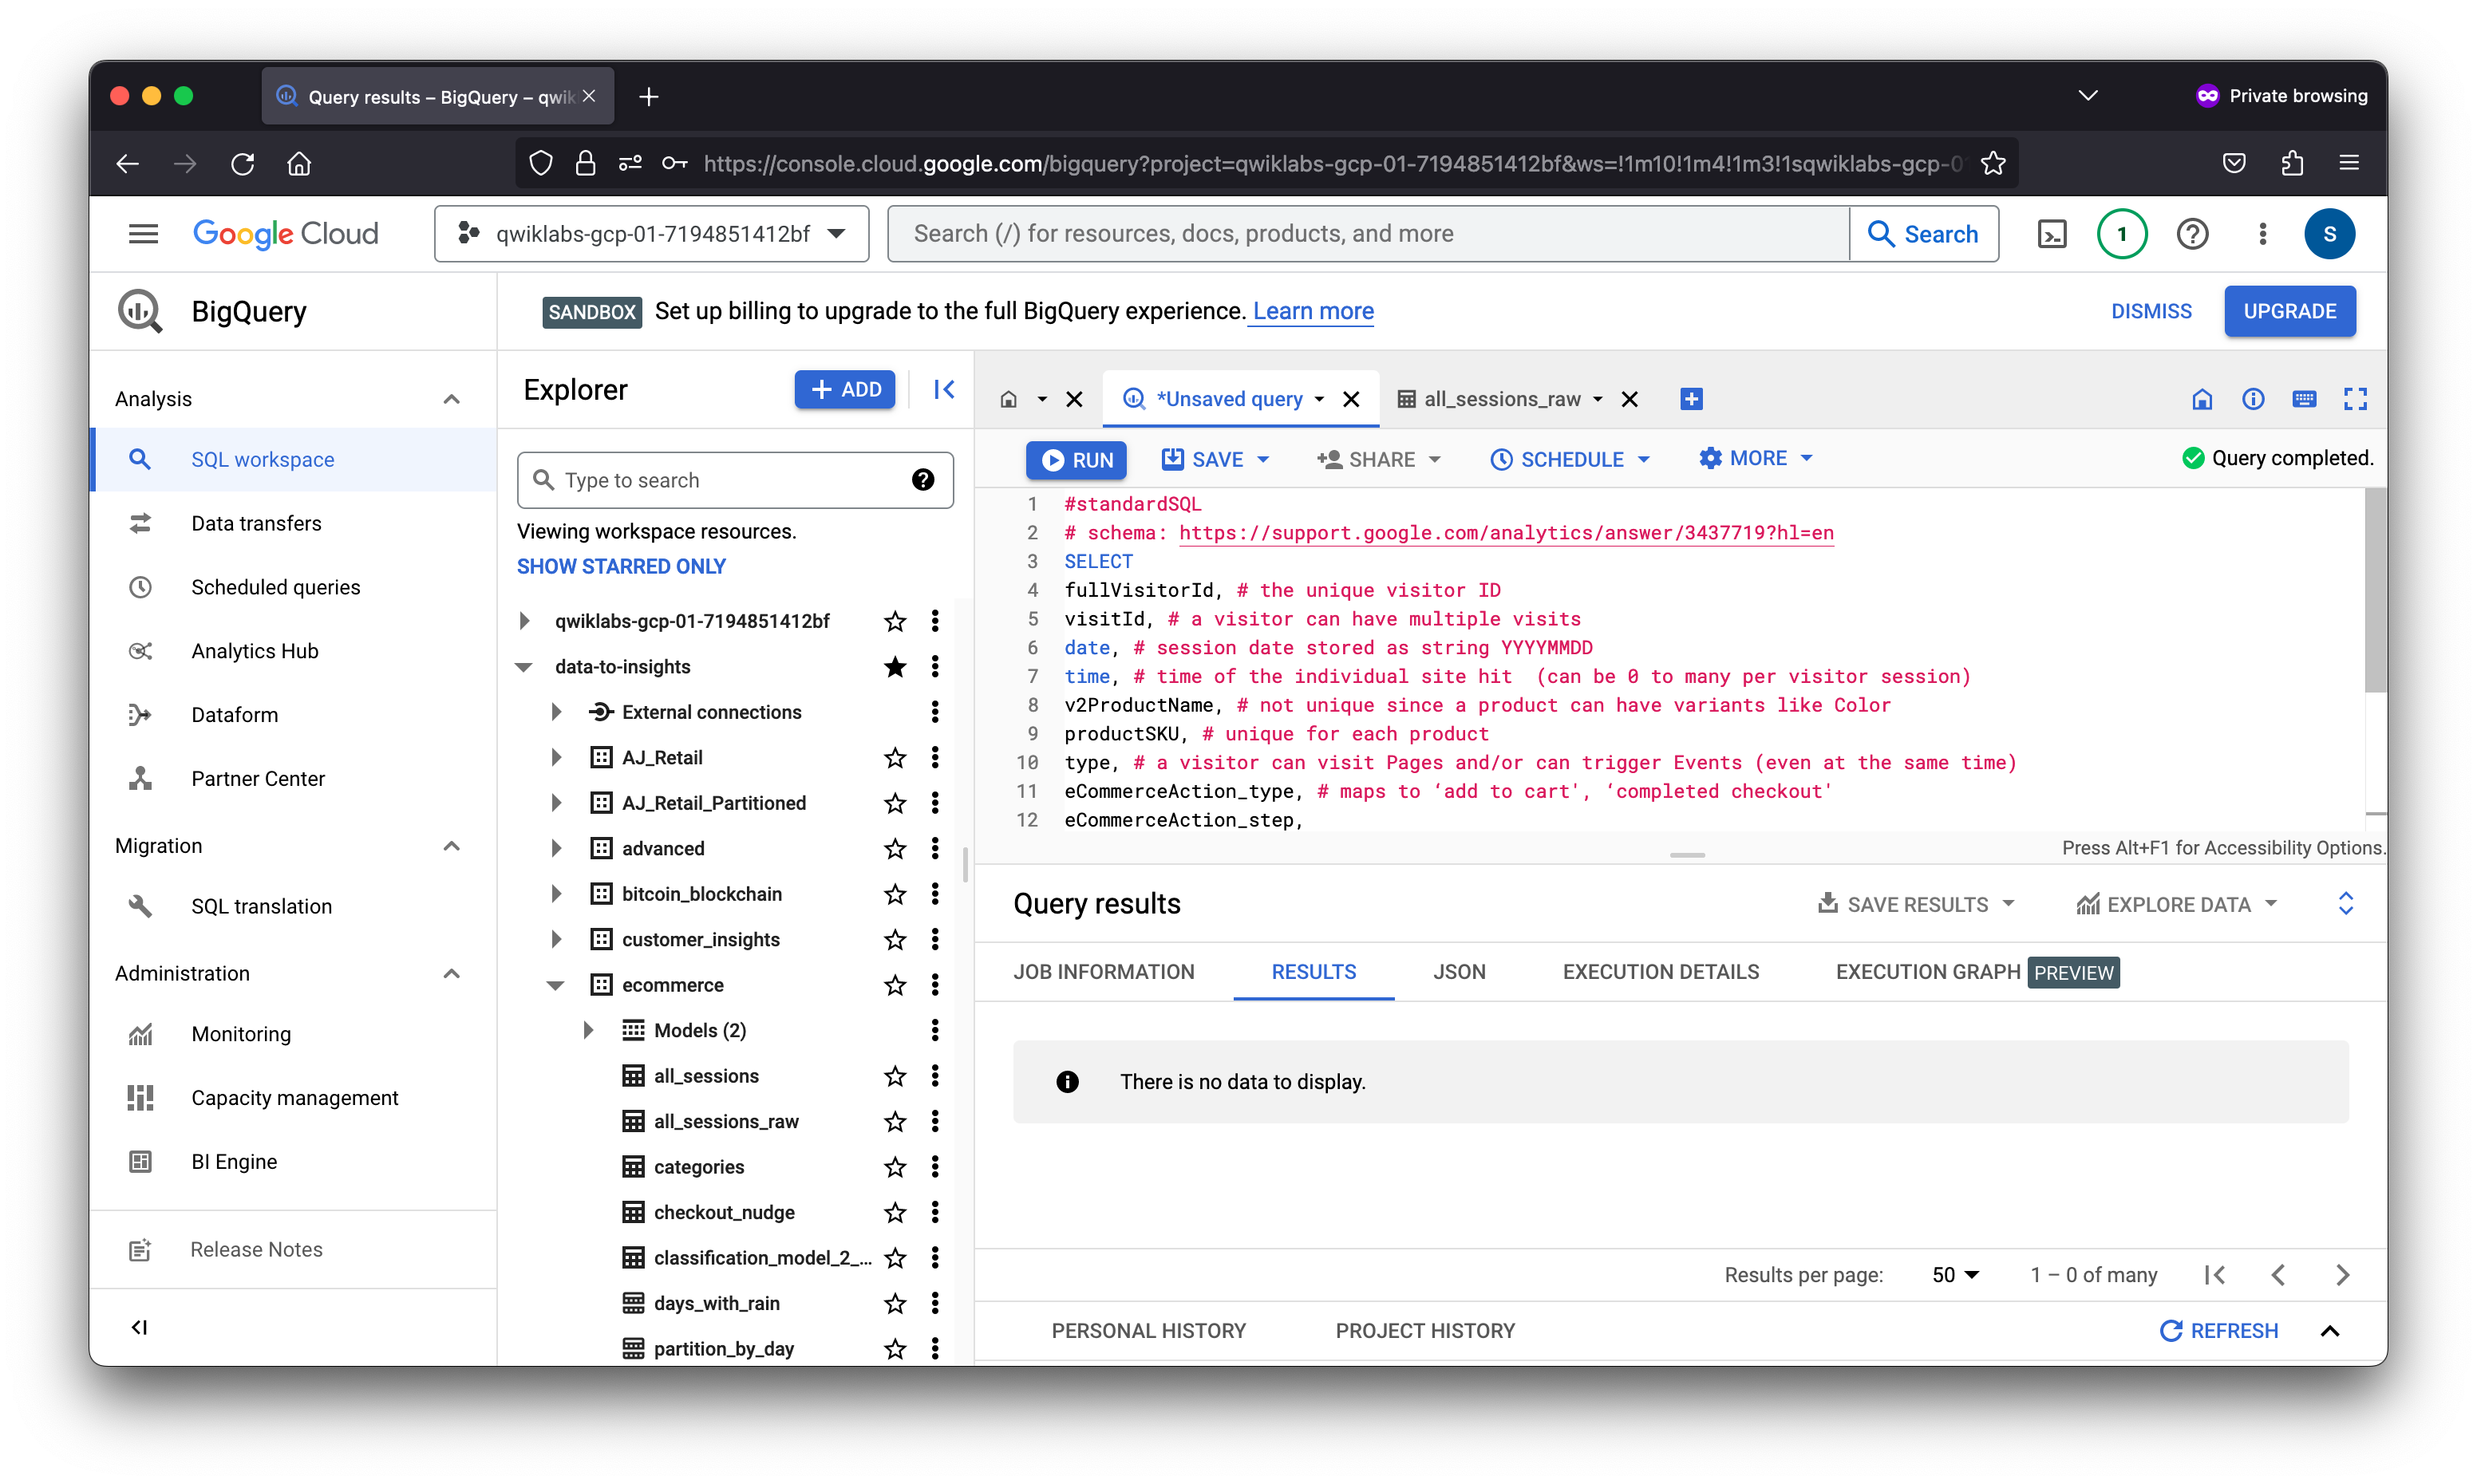
- Run the query to confirm that no duplicates exist, this time in the
all_sessionstable:
#standardSQL
# schema: https://support.google.com/analytics/answer/3437719?hl=en
SELECT
fullVisitorId, # the unique visitor ID
visitId, # a visitor can have multiple visits
date, # session date stored as string YYYYMMDD
time, # time of the individual site hit  (can be 0 to many per visitor session)
v2ProductName, # not unique since a product can have variants like Color
productSKU, # unique for each product
type, # a visitor can visit Pages and/or can trigger Events (even at the same time)
eCommerceAction_type, # maps to ‘add to cart', ‘completed checkout'
eCommerceAction_step,
eCommerceAction_option,
  transactionRevenue, # revenue of the order
  transactionId, # unique identifier for revenue bearing transaction
COUNT(*) as row_count
FROM
`data-to-insights.ecommerce.all_sessions`
GROUP BY 1,2,3 ,4, 5, 6, 7, 8, 9, 10,11,12
HAVING row_count > 1 # find duplicates
Note: In SQL, you can GROUP BY or ORDER BY the index of the column like using GROUP BY 1 instead of GROUP BY fullVisitorId.
3. Write basic SQL on ecommerce data
In this section, you query for insights on the ecommerce dataset.
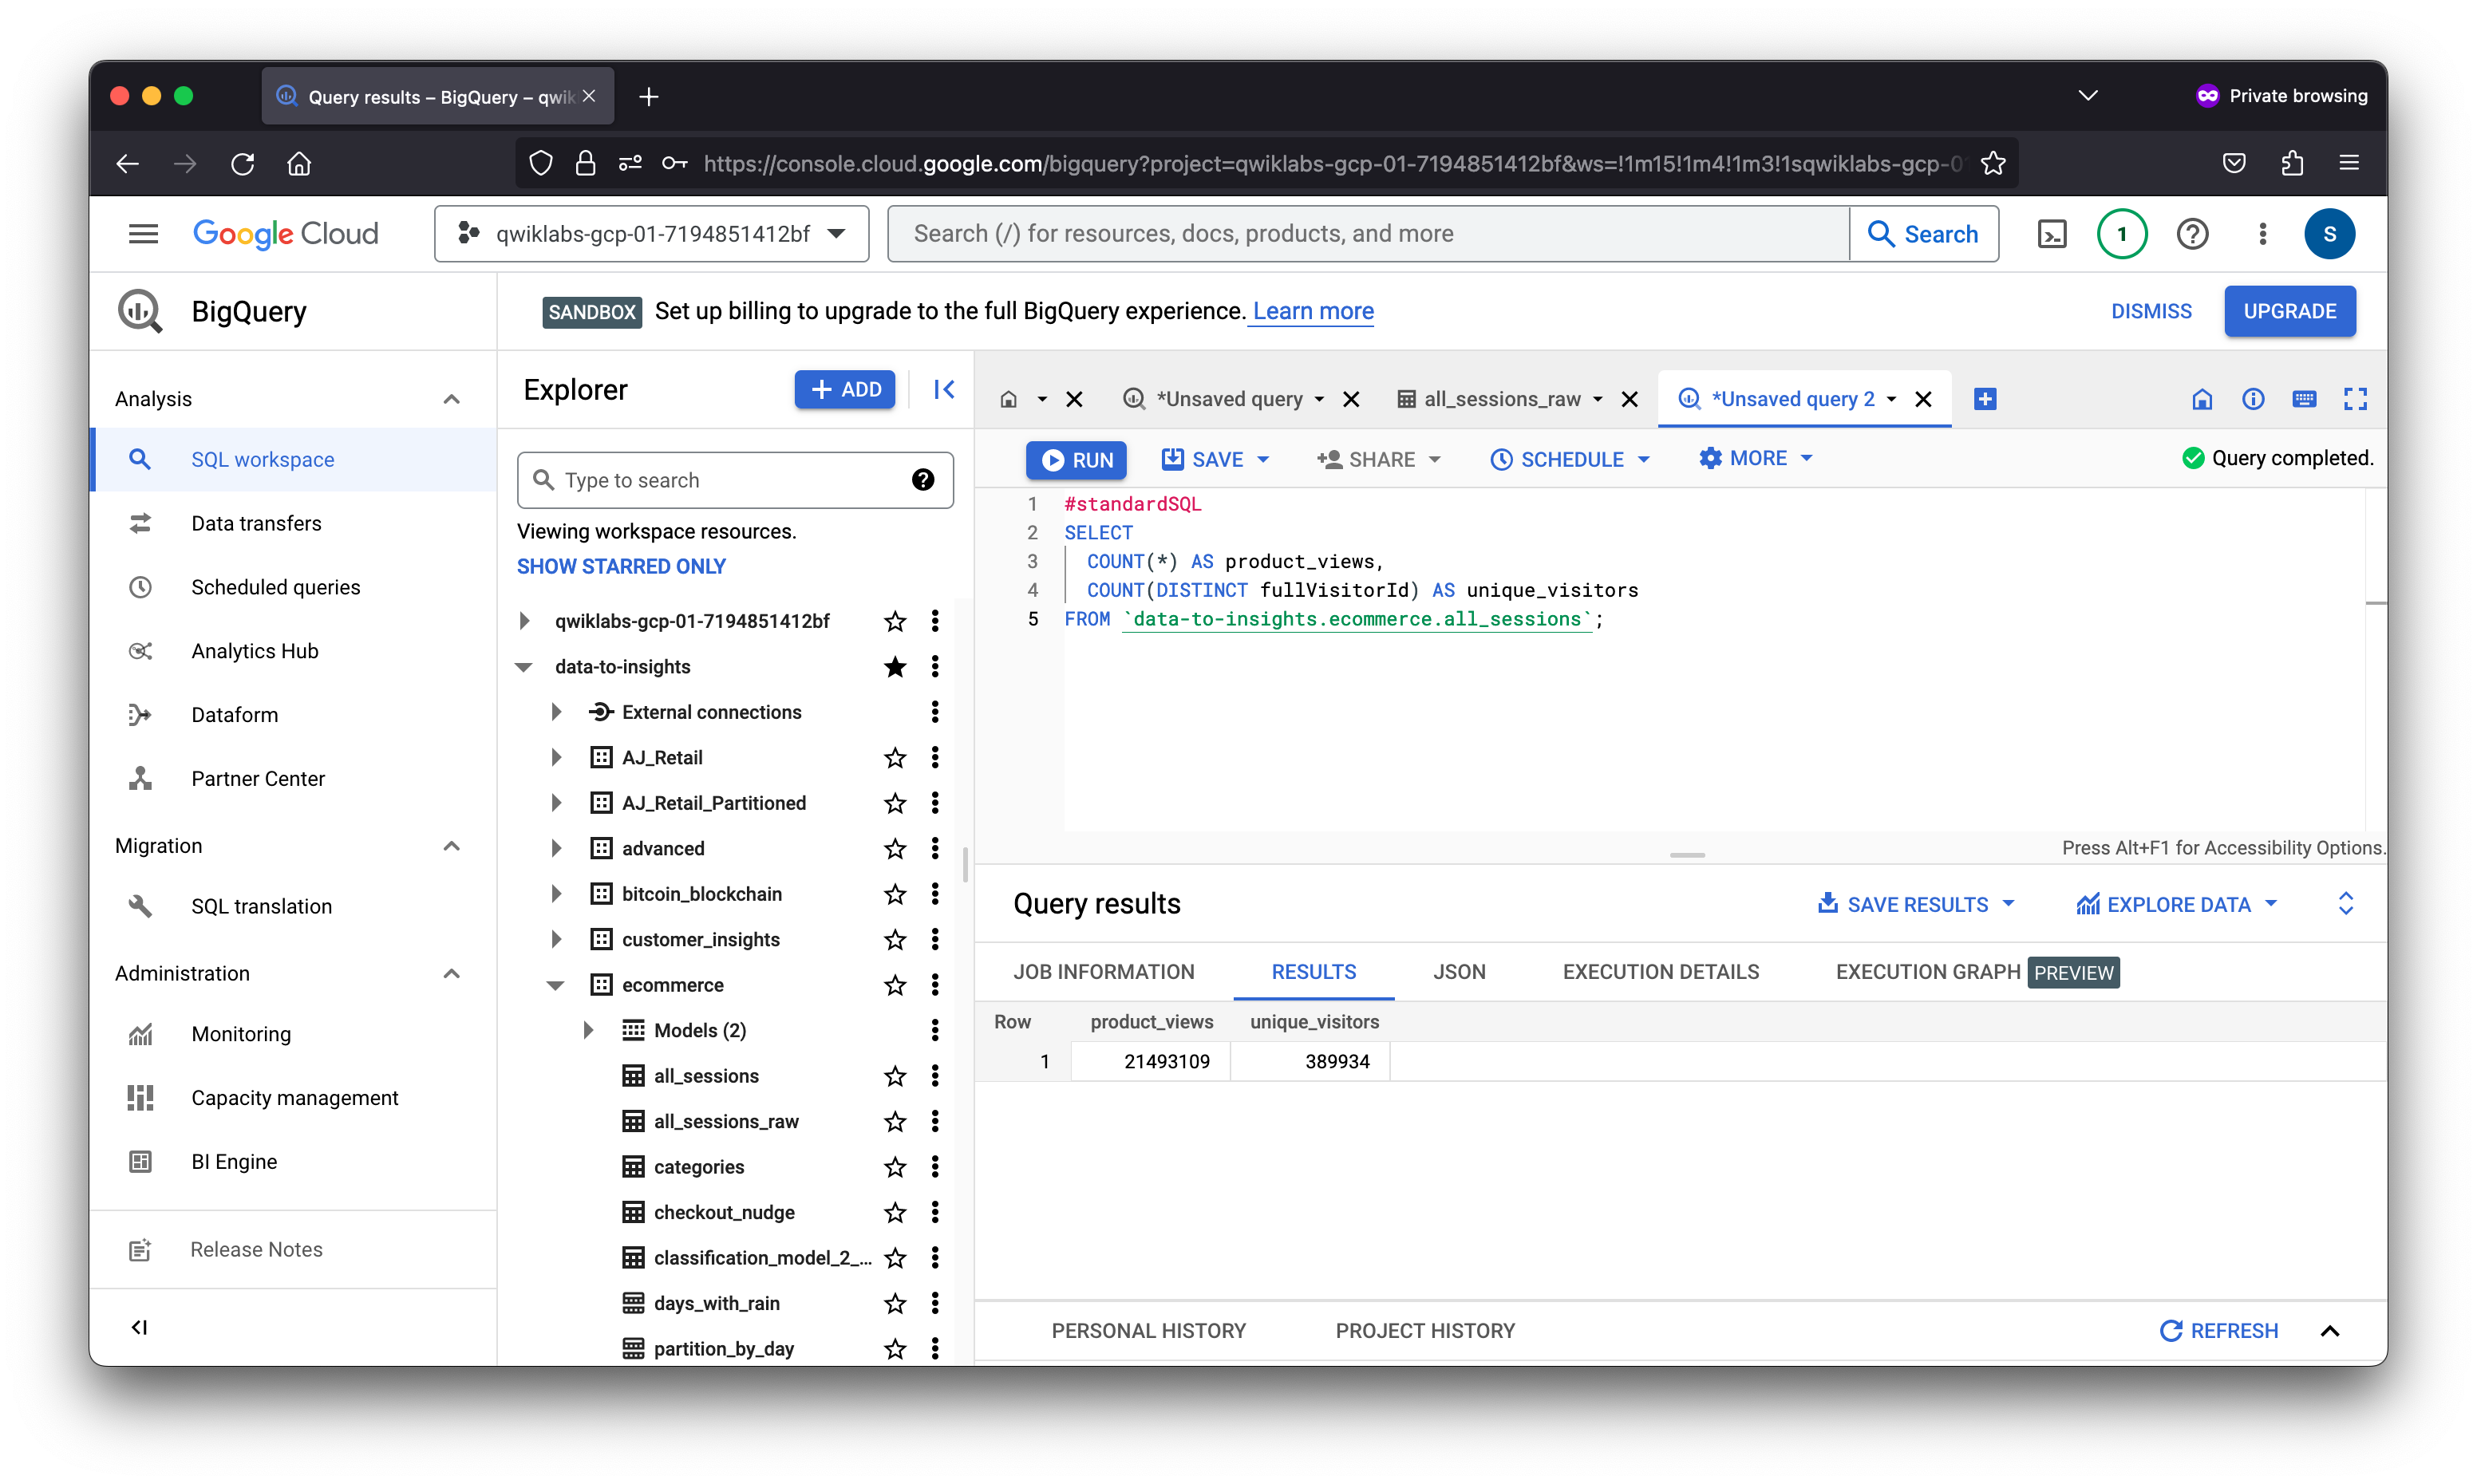
Write a query that shows total unique visitors
Your query determines the total views by counting product_views and the number of unique visitors by counting fullVisitorID.
- Click “+” (Compose New Query) icon.
- Write this query in the editor:
#standardSQL
SELECT
  COUNT(*) AS product_views,
  COUNT(DISTINCT fullVisitorId) AS unique_visitors
FROM `data-to-insights.ecommerce.all_sessions`;
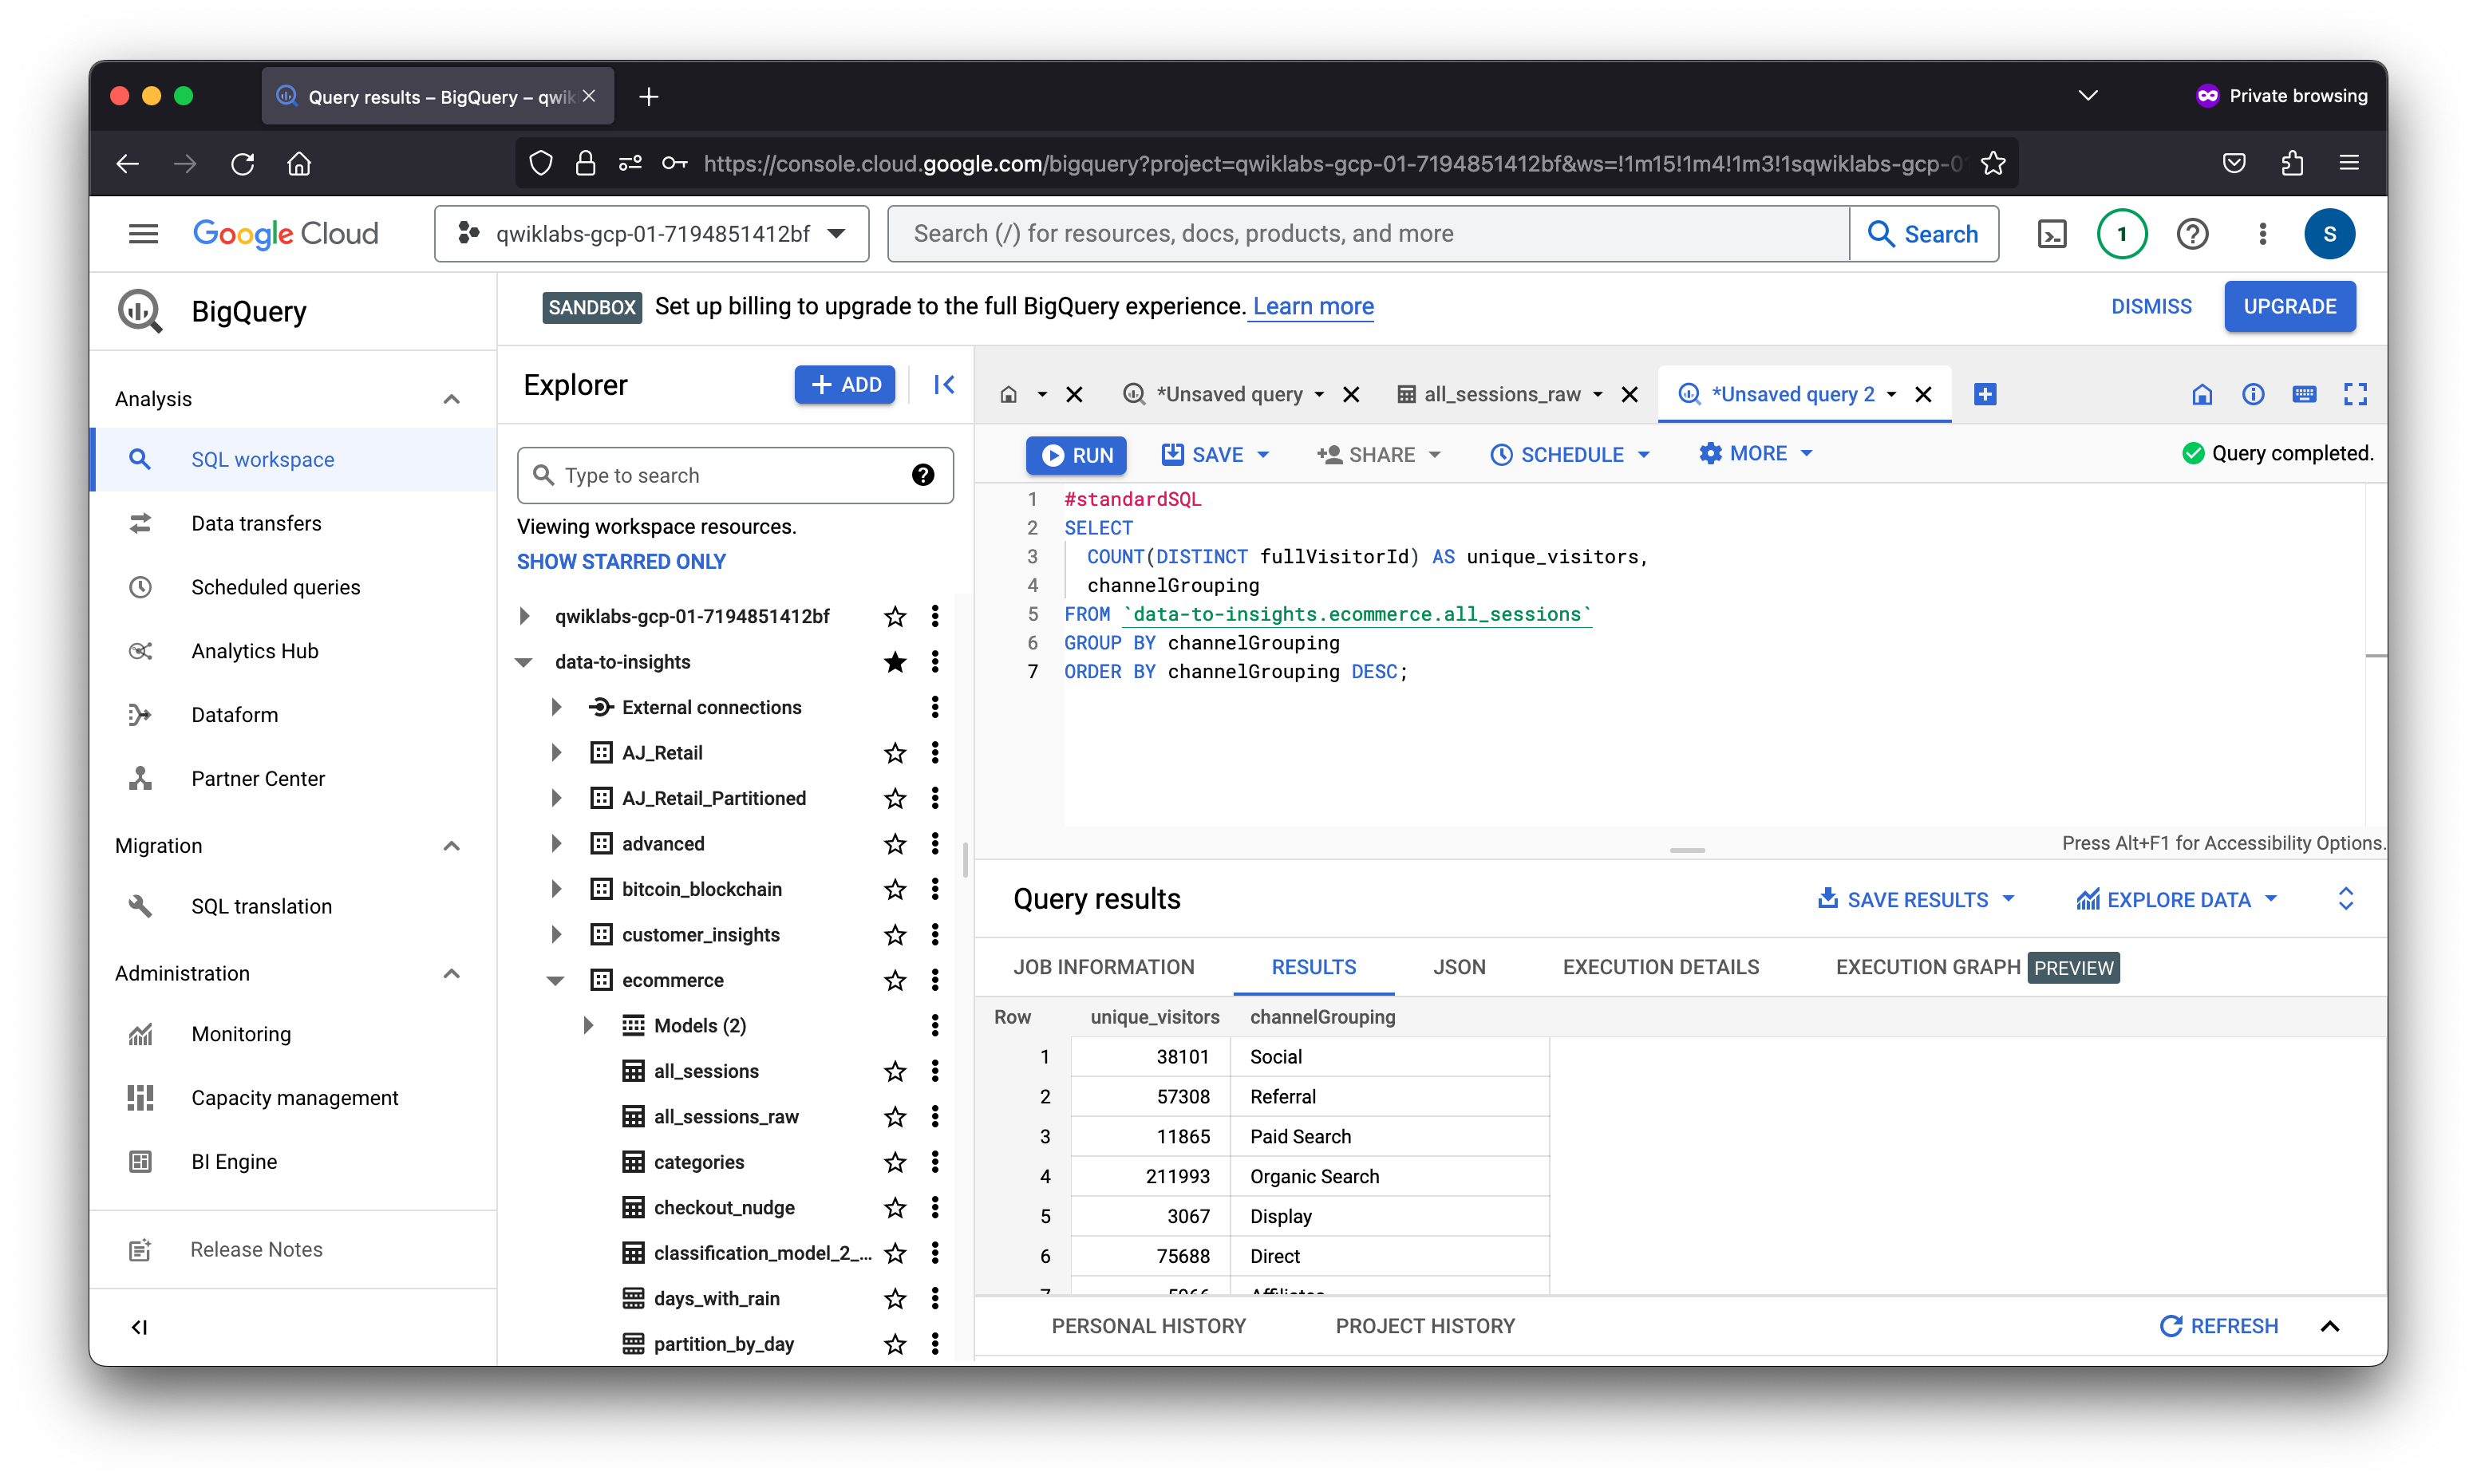
#standardSQL
SELECT
  COUNT(DISTINCT fullVisitorId) AS unique_visitors,
  channelGrouping
FROM `data-to-insights.ecommerce.all_sessions`
GROUP BY channelGrouping
ORDER BY channelGrouping DESC;
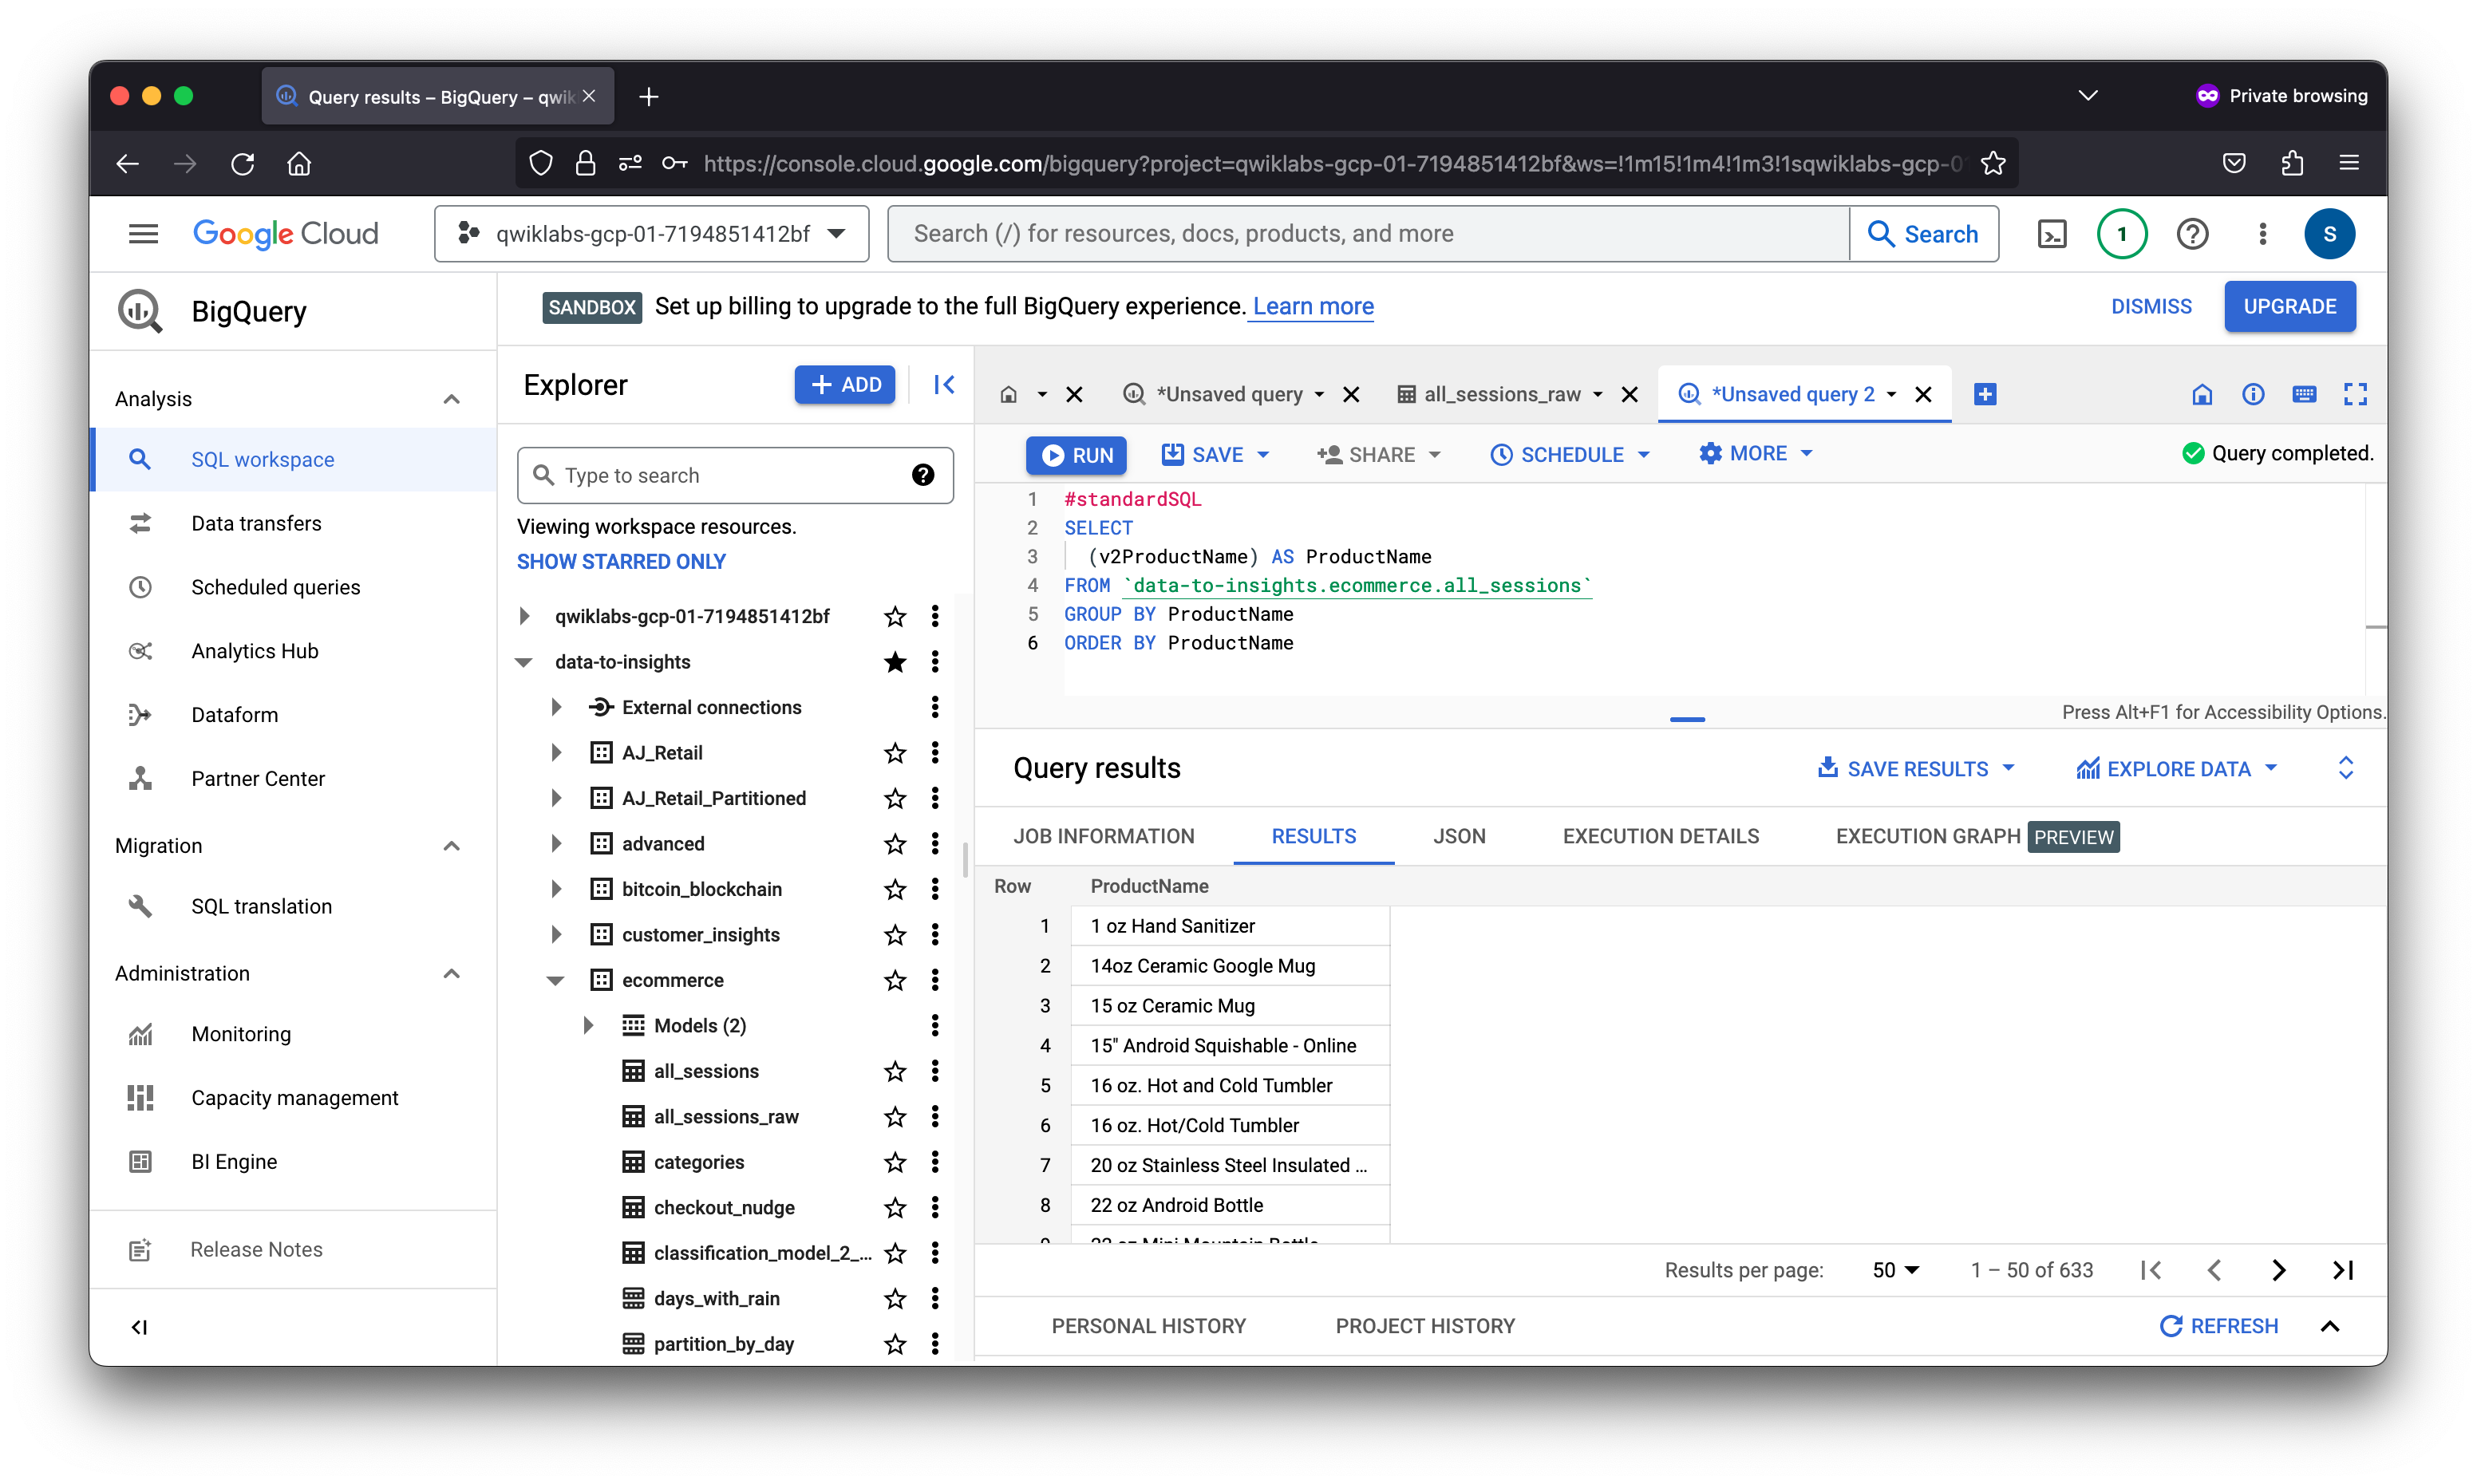
#standardSQL
SELECT
  (v2ProductName) AS ProductName
FROM `data-to-insights.ecommerce.all_sessions`
GROUP BY ProductName
ORDER BY ProductName
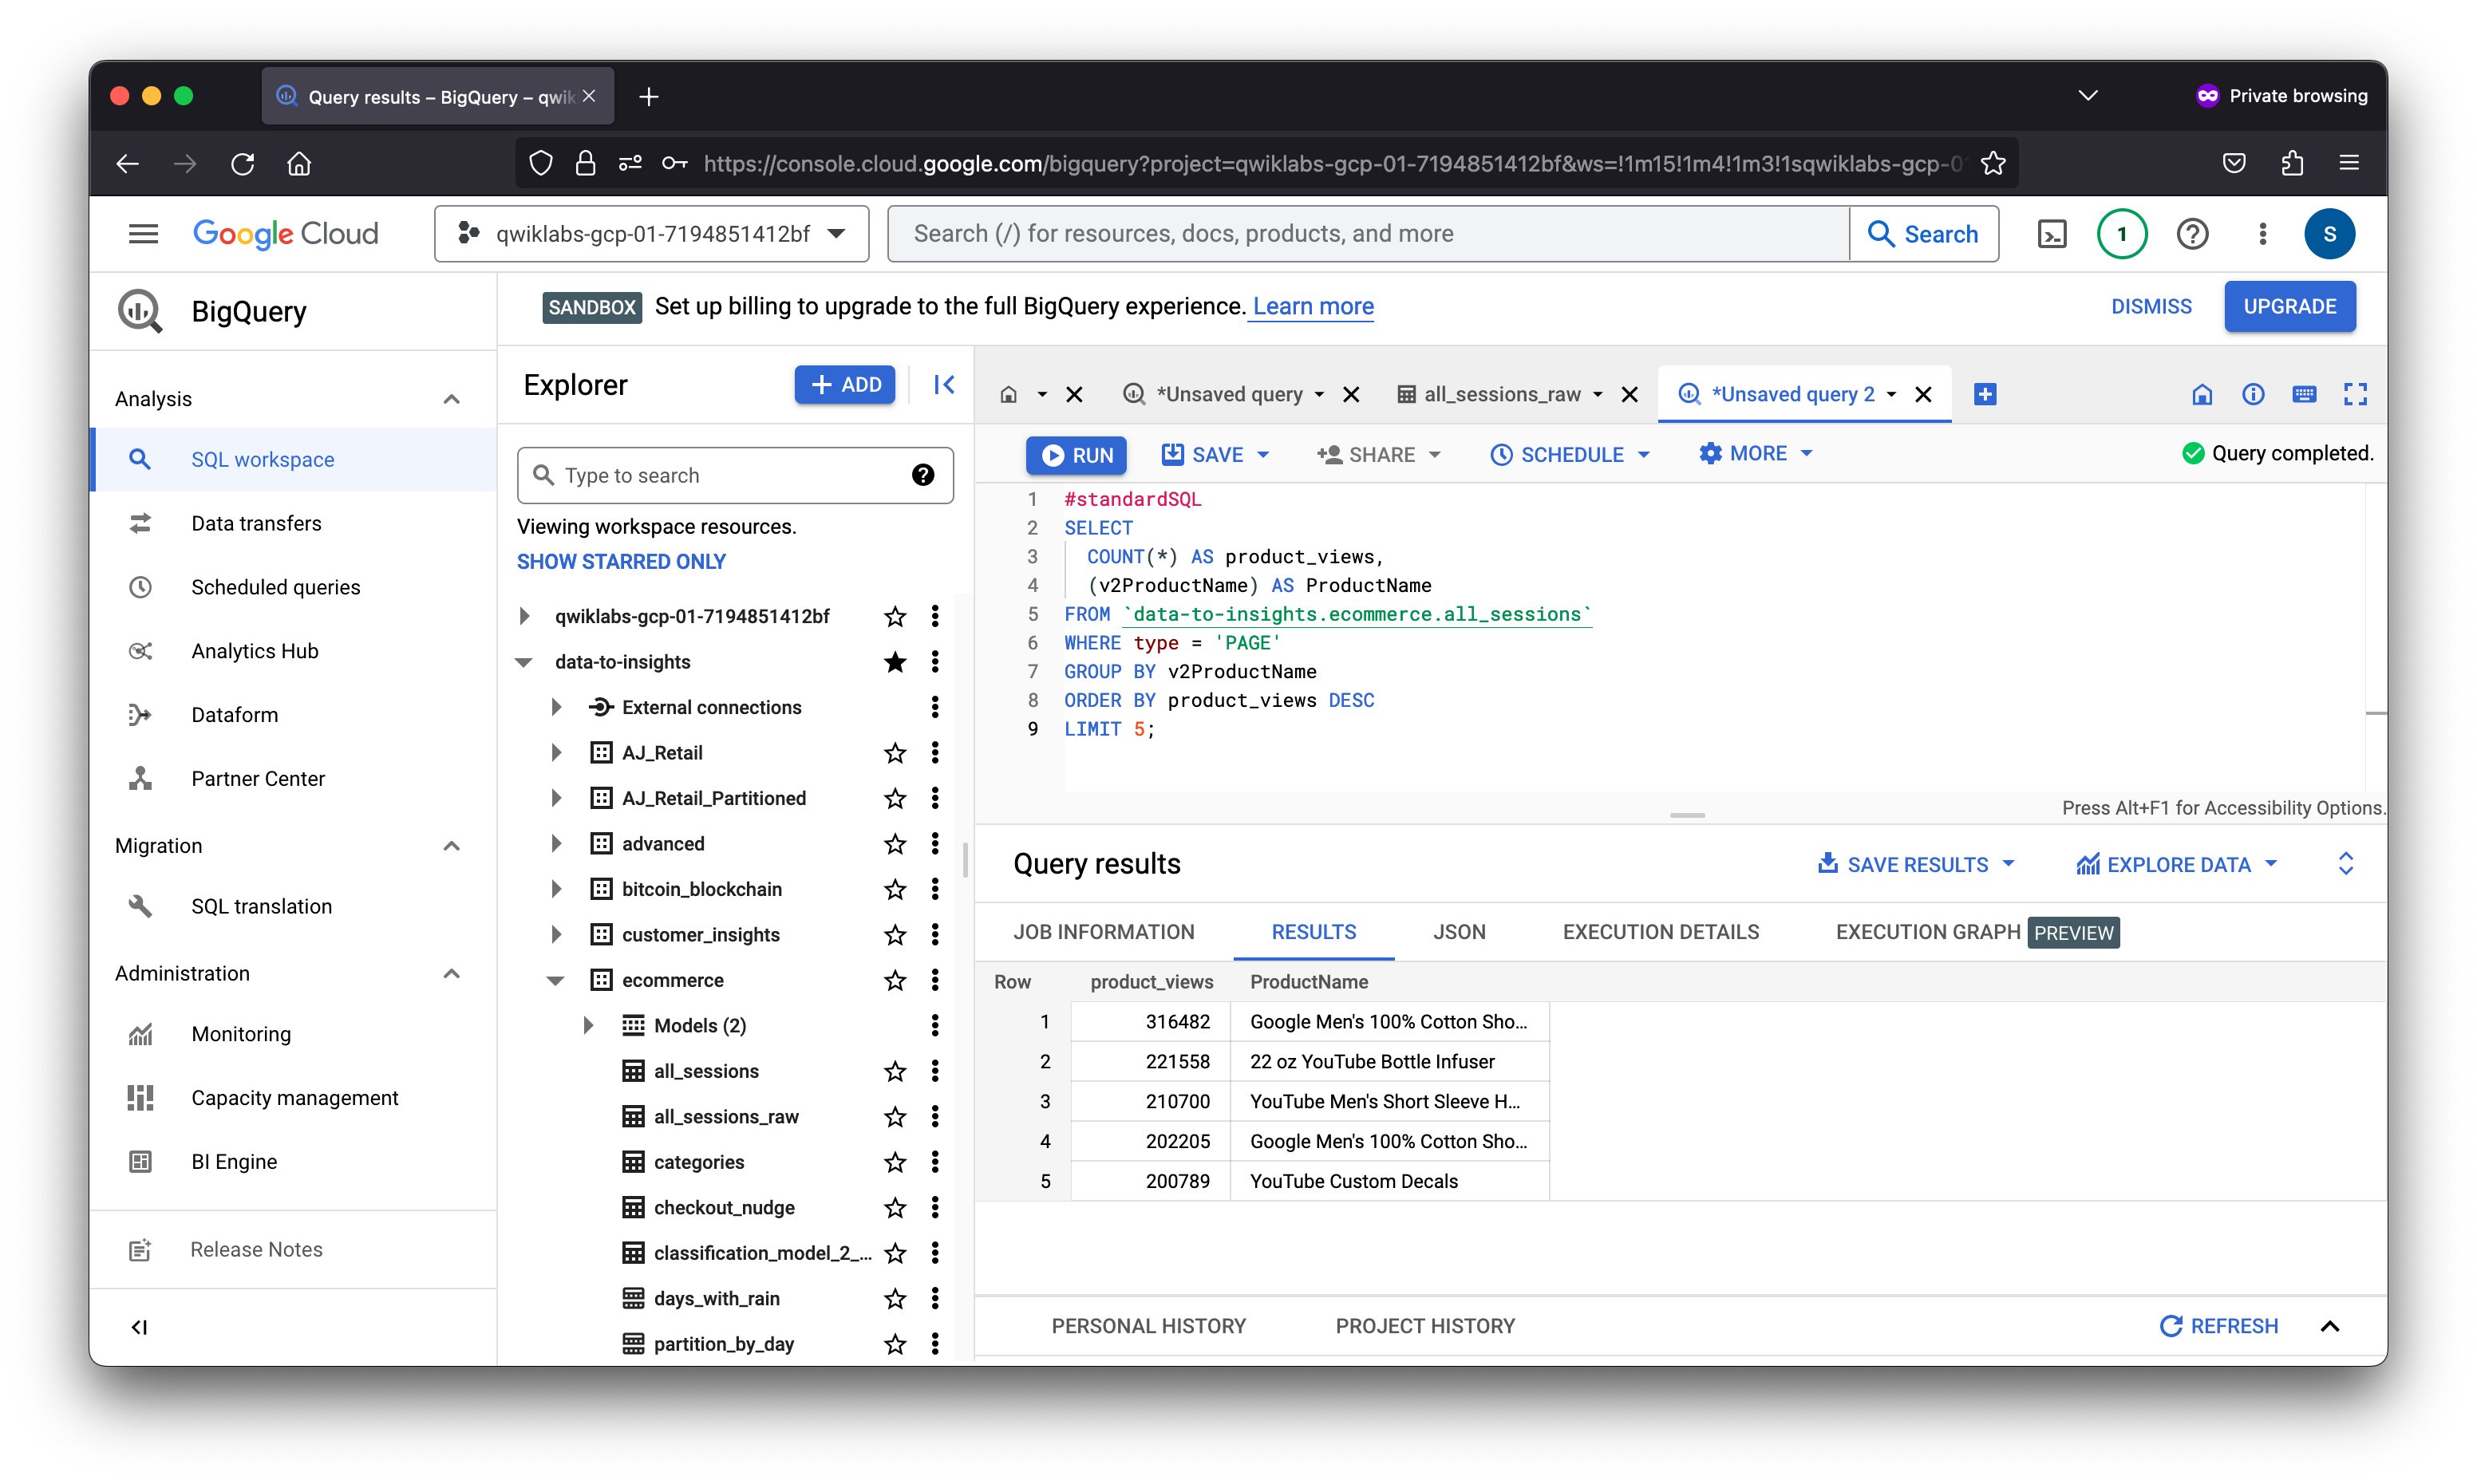
#standardSQL
SELECT
  COUNT(*) AS product_views,
  (v2ProductName) AS ProductName
FROM `data-to-insights.ecommerce.all_sessions`
WHERE type = 'PAGE'
GROUP BY v2ProductName
ORDER BY product_views DESC
LIMIT 5;
WITH unique_product_views_by_person AS (
-- find each unique product viewed by each visitor
SELECT
 fullVisitorId,
 (v2ProductName) AS ProductName
FROM `data-to-insights.ecommerce.all_sessions`
WHERE type = 'PAGE'
GROUP BY fullVisitorId, v2ProductName )
-- aggregate the top viewed products and sort them
SELECT
  COUNT(*) AS unique_view_count,
  ProductName
FROM unique_product_views_by_person
GROUP BY ProductName
ORDER BY unique_view_count DESC
LIMIT 5
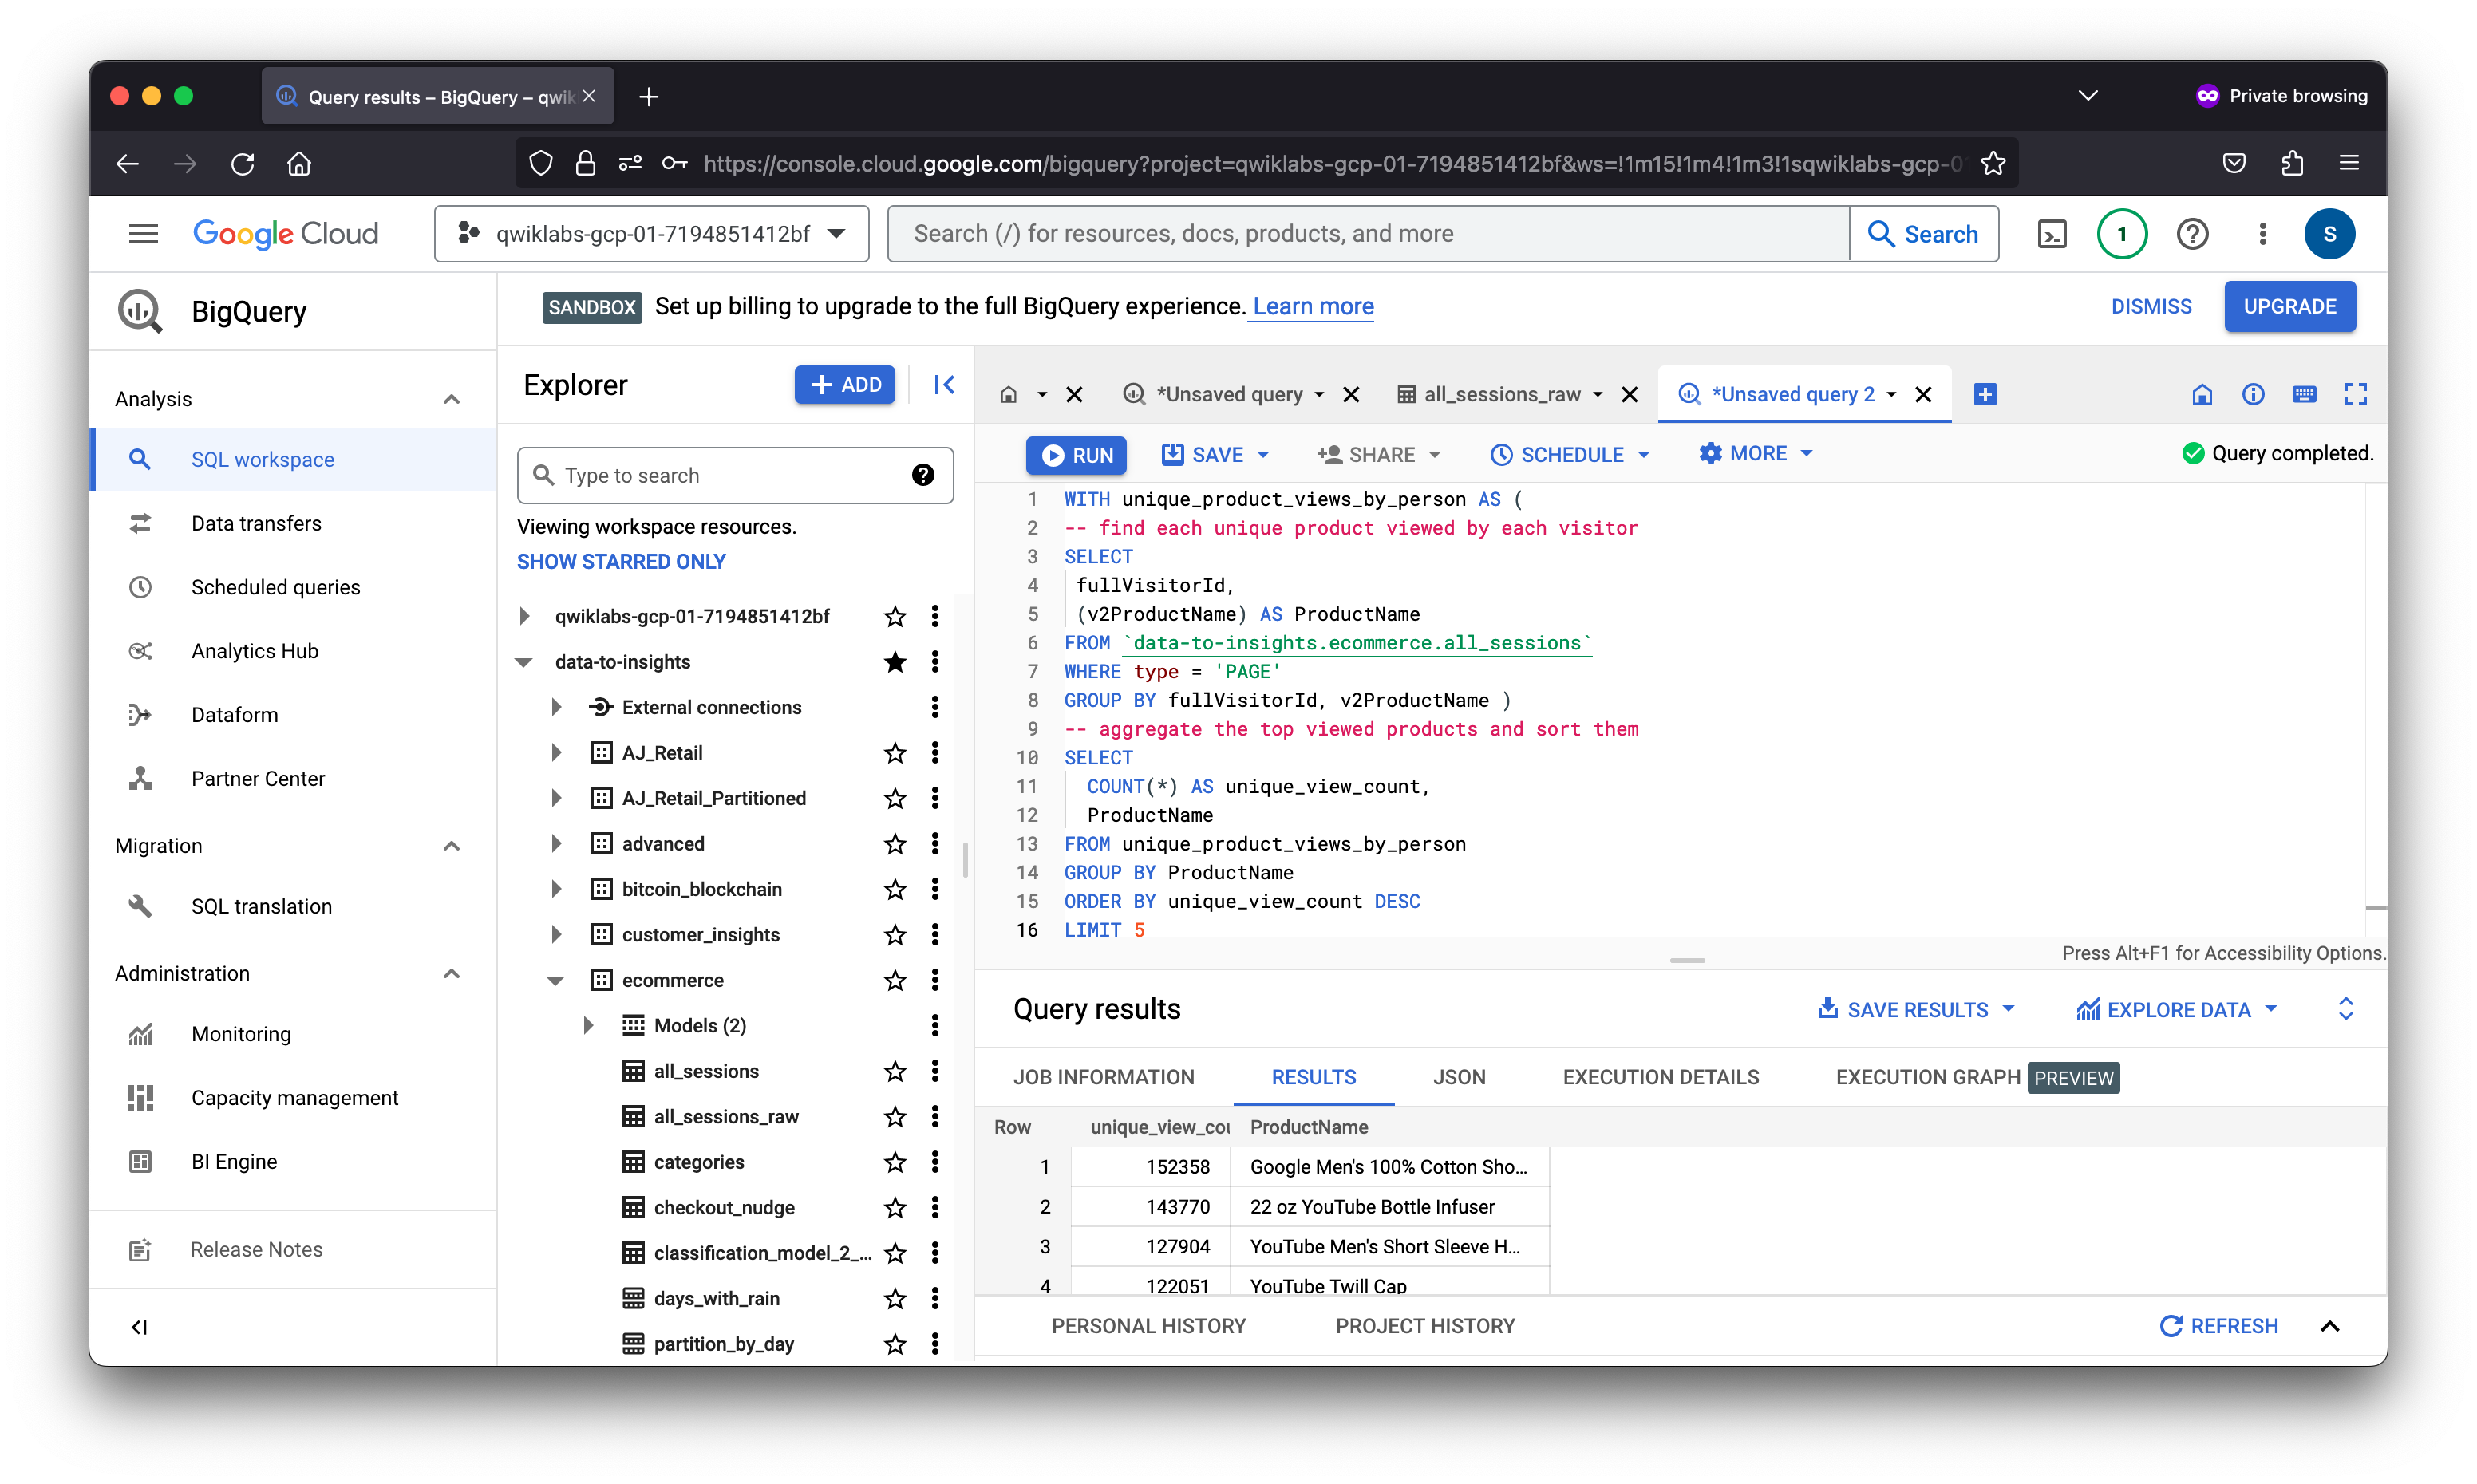
Tip: You can use the SQL WITH clause to help break apart a complex query into multiple steps. Here we first create a query that finds each unique product per visitor and counts them once. Then the second query performs the aggregation across all visitors and products.
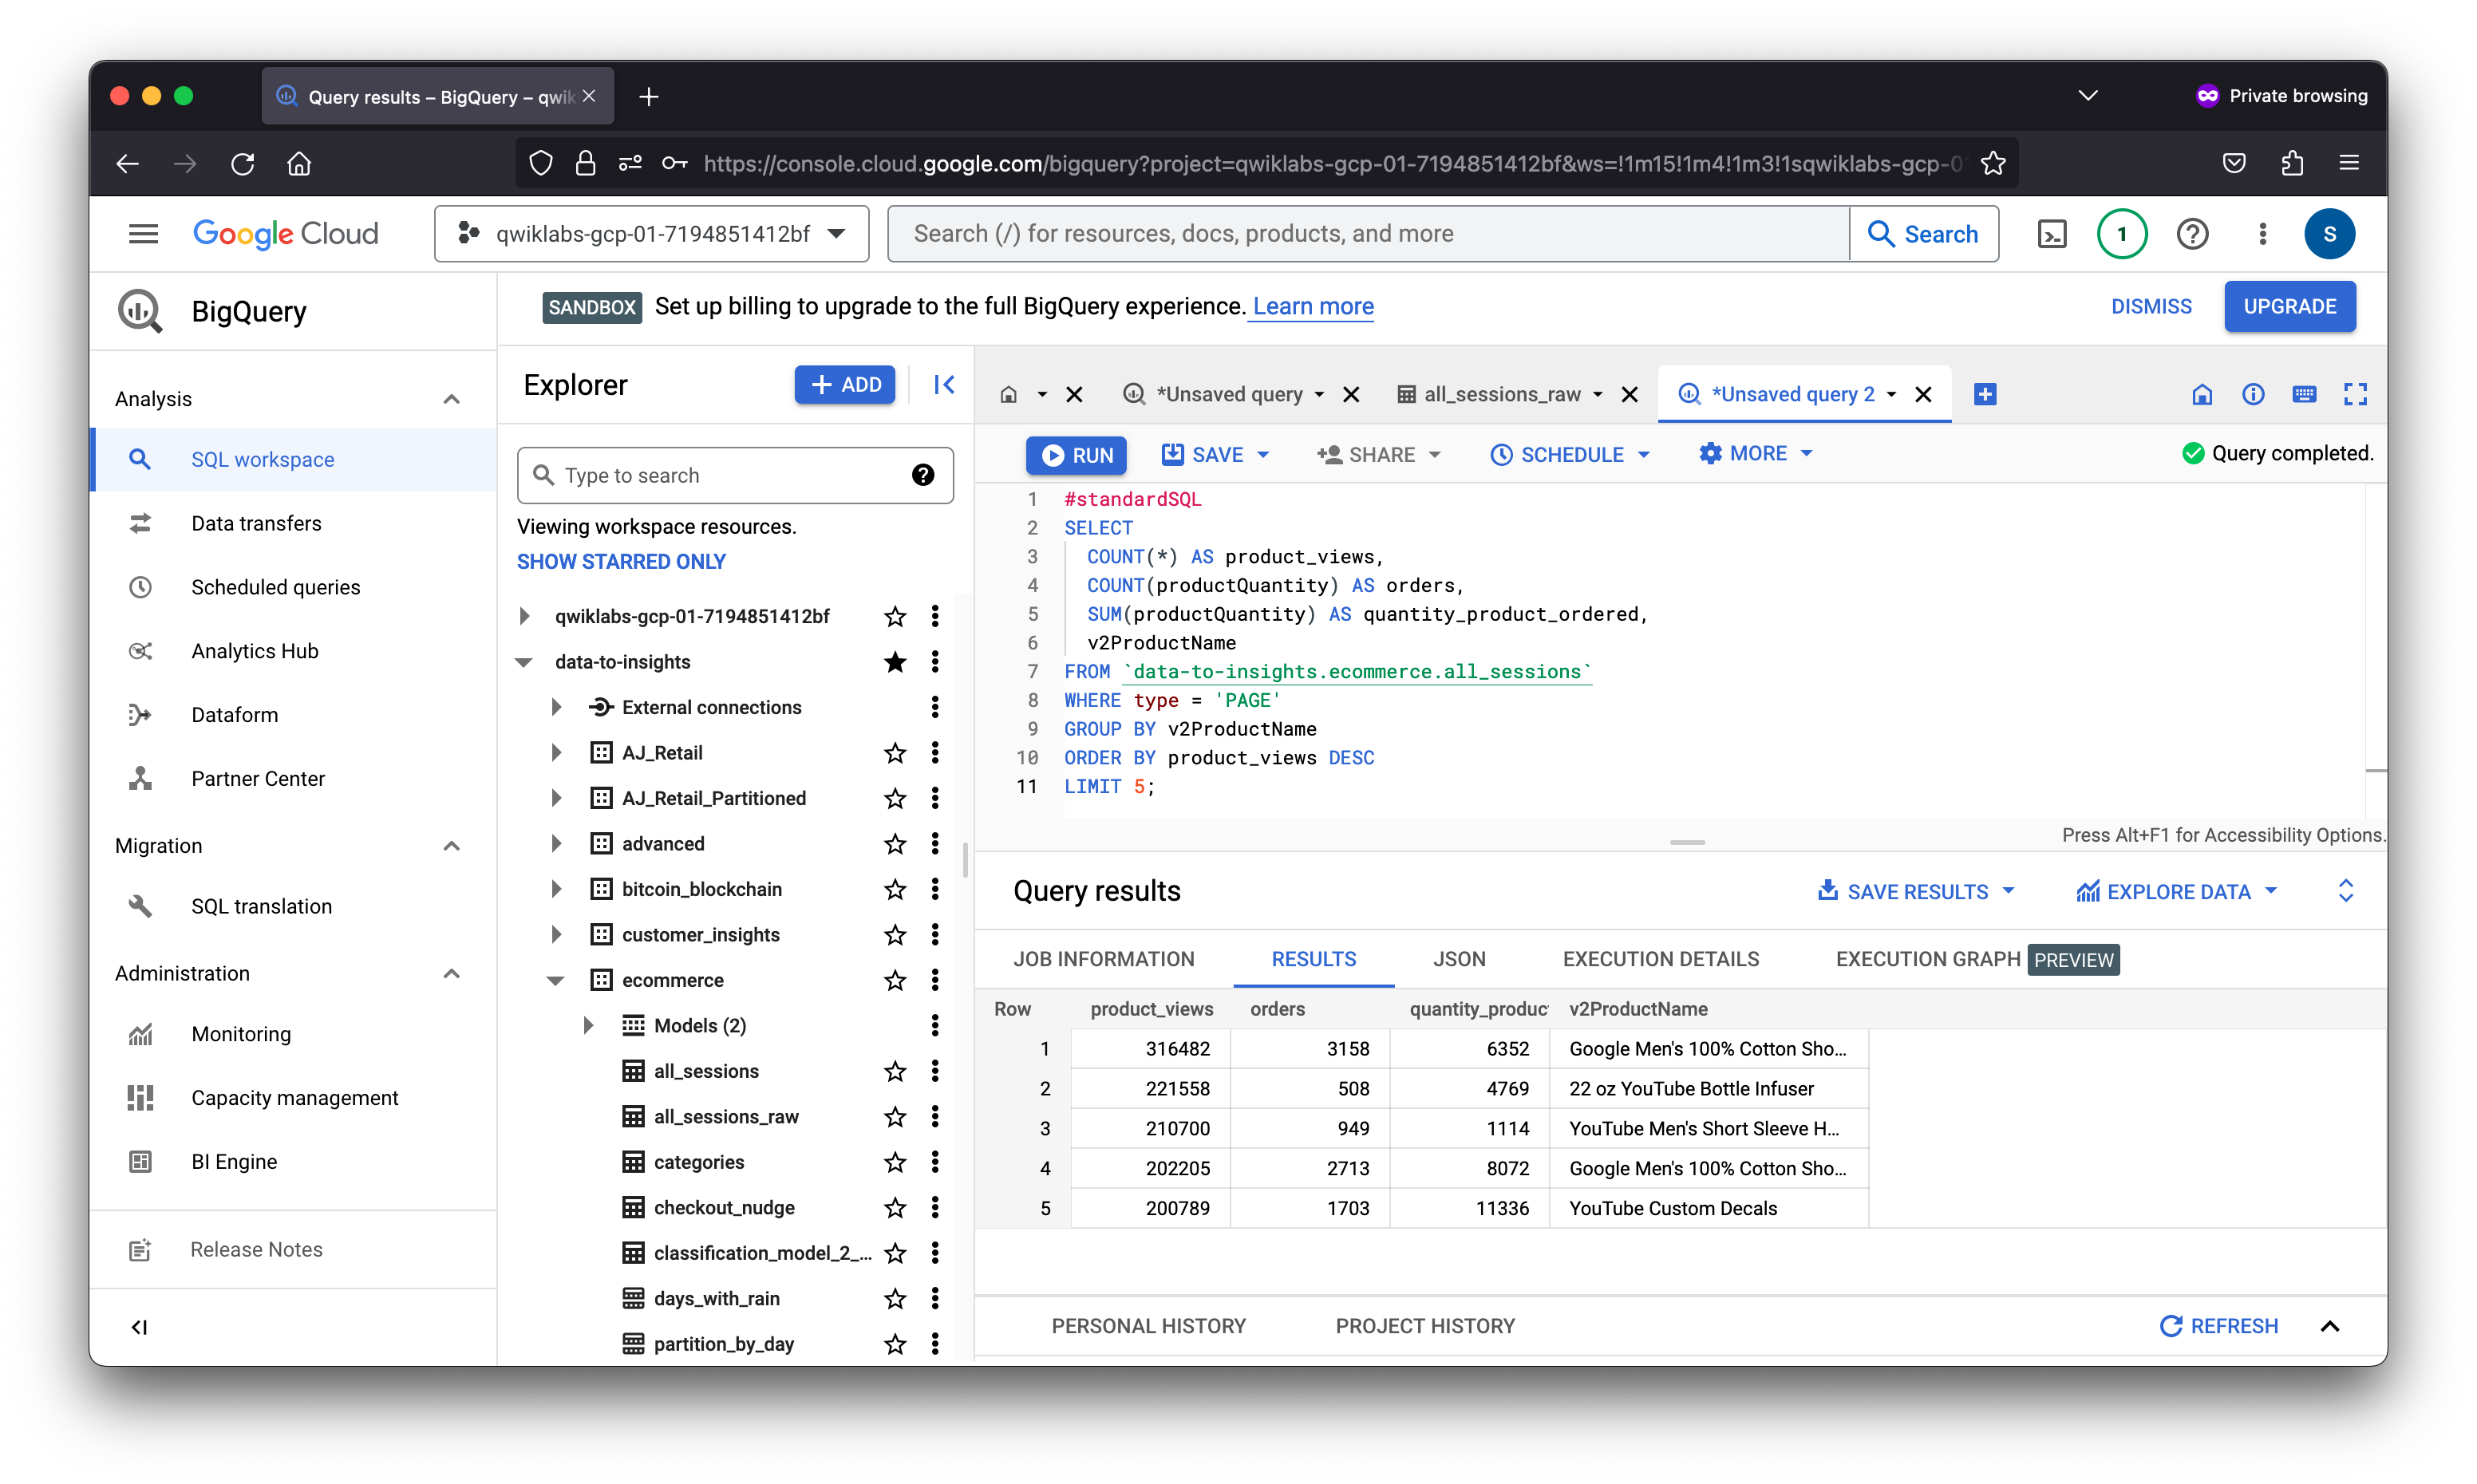
#standardSQL
SELECT
  COUNT(*) AS product_views,
  COUNT(productQuantity) AS orders,
  SUM(productQuantity) AS quantity_product_ordered,
  v2ProductName
FROM `data-to-insights.ecommerce.all_sessions`
WHERE type = 'PAGE'
GROUP BY v2ProductName
ORDER BY product_views DESC
LIMIT 5;
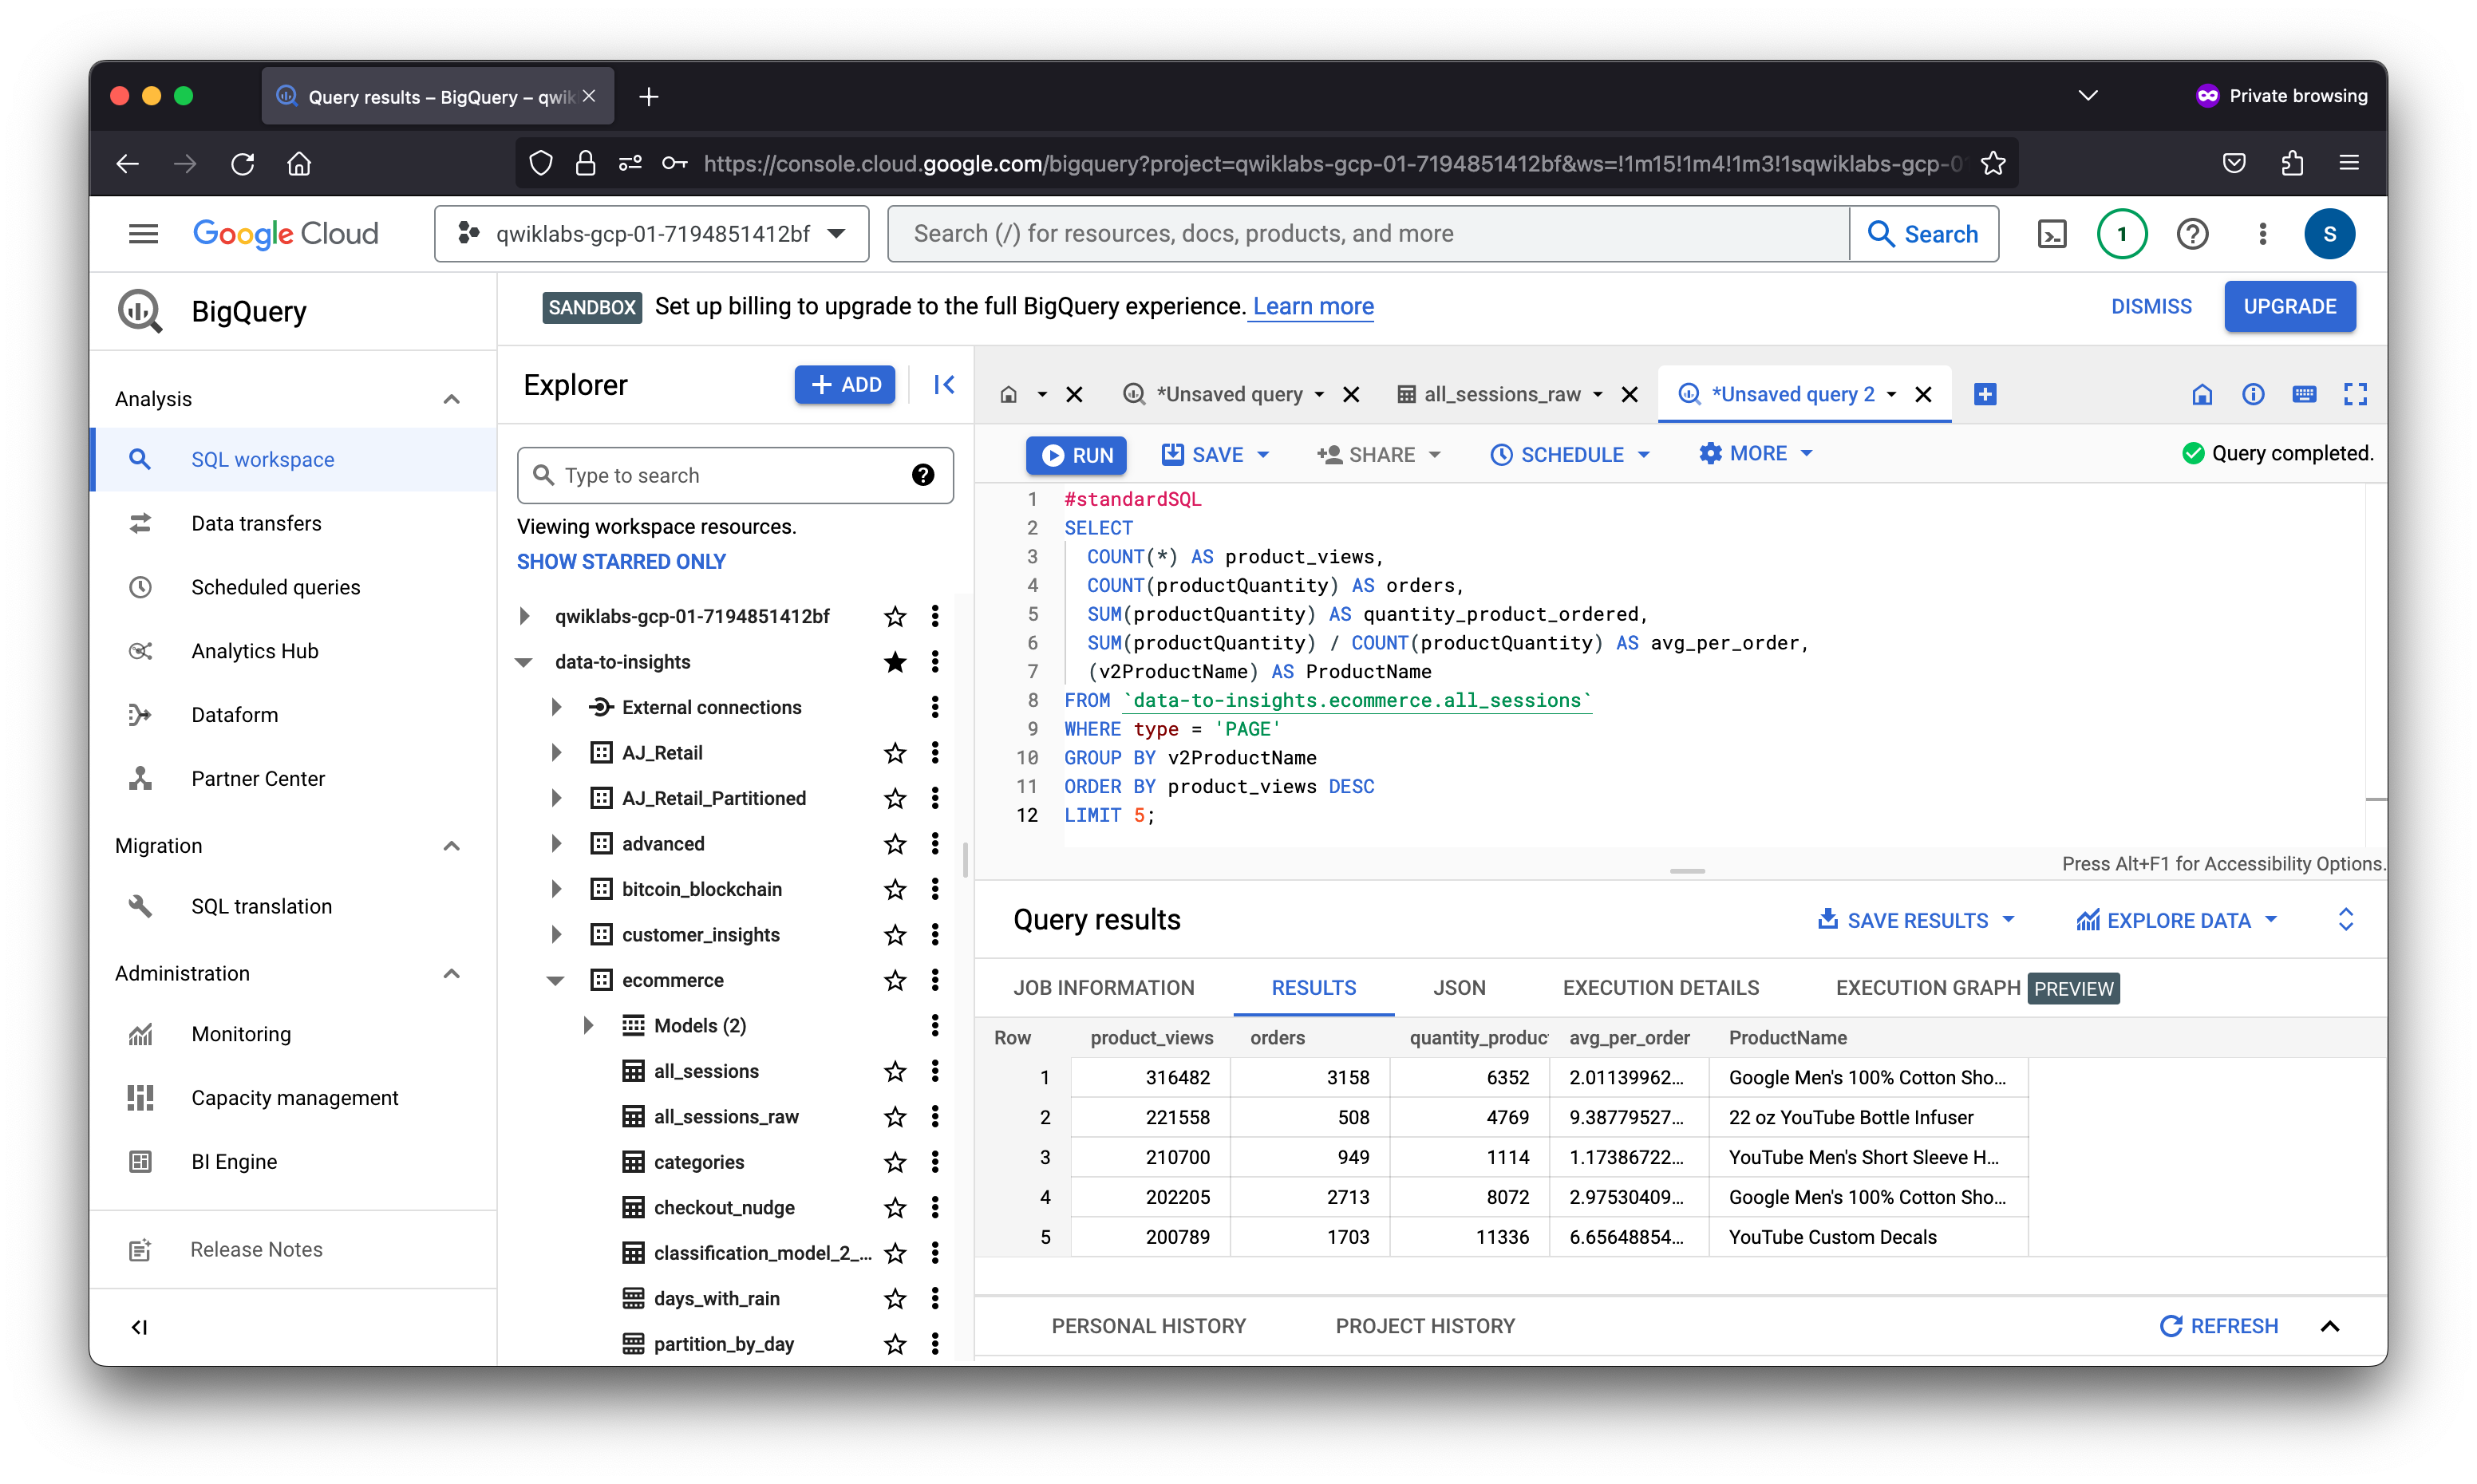
#standardSQL
SELECT
  COUNT(*) AS product_views,
  COUNT(productQuantity) AS orders,
  SUM(productQuantity) AS quantity_product_ordered,
  SUM(productQuantity) / COUNT(productQuantity) AS avg_per_order,
  (v2ProductName) AS ProductName
FROM `data-to-insights.ecommerce.all_sessions`
WHERE type = 'PAGE'
GROUP BY v2ProductName
ORDER BY product_views DESC
LIMIT 5;
This concludes exploring the data-to-insights ecommerce dataset! You used BigQuery to view and query the data to gain meaningful insight on various aspects of product marketing.